PopSockets turned off Google in a set of matched markets and measured what disappeared.

PopSockets and Stella · Google Ads · Inverse geo holdout · 28 day test
PopSockets turned Google off in a set of matched markets and measured the revenue that went with it. Over 28 days, PopSockets.com revenue in the holdout markets came in about $34K and 631 orders below Stella's prediction, at 99% significance. Against a $26.6K spend basis, that is a 1.29x incremental ROAS for the test period.
The Customer
PopSockets makes the collapsible phone grip and sells grips, cases, and phone accessories through PopSockets.com, Amazon, and major retailers. Google is one of its main paid channels. With three places to buy, an ad can start a purchase on one channel and finish it on another. Each ad platform reports its own version of what worked. PopSockets wanted budget decisions built on its own revenue.
The Problem
Before Stella, the team read Google's performance through Google Ads reporting. Google grades its own work. Its attribution credits conversions that follow a click, but it can't tell whether the ad caused the sale or just came before it. A shopper who would have bought anyway still shows up as a Google conversion.
A geo holdout measures what changes when the ads come off. You turn the ads off in some markets and compare them to the rest. The hard part is picking the markets. If the holdout markets don't behave like the rest of the country, the gap could be anything.
PopSockets wanted a causal read on Google it could defend in a budget meeting.
The Test
The test ran as an inverse geo holdout in Stella from February 10 to March 9, 2026. Google Ads came off in a small set of DMAs and kept running everywhere else. The overall Google budget was cut by the holdout's share to keep extra spend from shifting into the control markets.
The setup started with location selection. Instead of picking test markets by gut, Stella scanned PopSockets' revenue history and paired holdout and control markets that already moved together, at a 0.95 correlation. It also checked that the test could detect an effect, sizing it to catch a revenue change as small as 5%.
From there, Stella built the "what would have happened" line using a weighted synthetic control: a blend of the control markets, weighted to match how the holdout markets behaved before the test. Before the test, that prediction sat within about 3% of actual revenue day to day (R² 0.98, MAPE 2.51%), right through Black Friday and the holidays. During the test, it rose with actual revenue around Valentine's Day.
The outcome was total revenue on PopSockets.com, from PopSockets' own sales data.
The Result
Over 28 days, the holdout markets lost about $34K in revenue and 631 orders against Stella's prediction. The revenue effect met Stella's 99% significance threshold. The test was built to catch a change as small as 5%, and the drop came in well above that.
Against a $26.6K spend basis, that's a 1.29x incremental ROAS for the test period, with a 90% interval of 0.94x to 1.64x, at $42.11 per incremental order. That describes these markets at this spend level, not the return on the next dollar of Google.
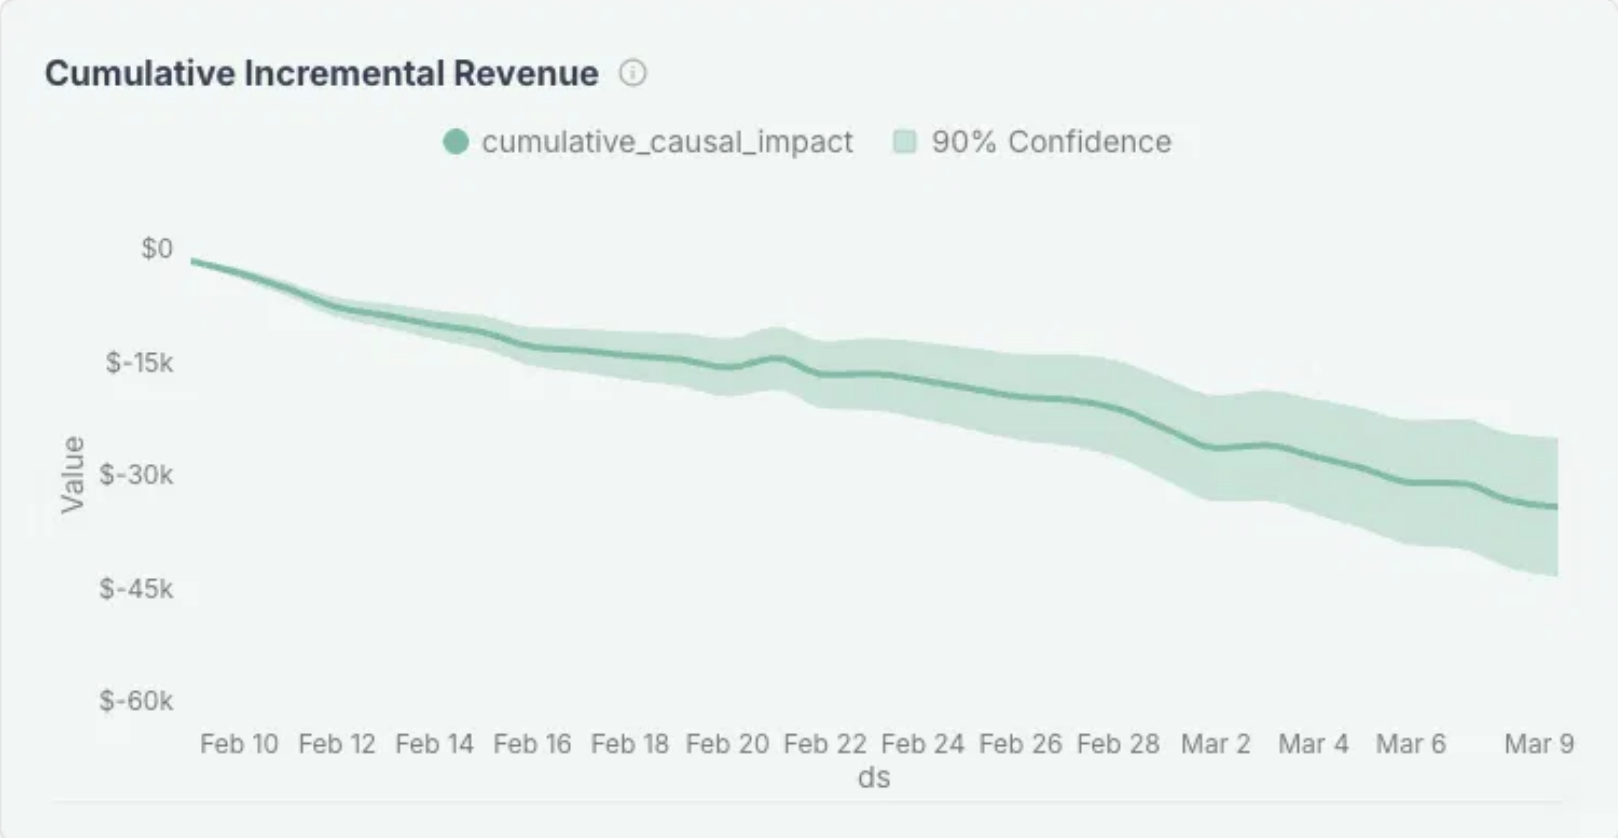
The difference between the prediction and actual revenue is the part Google was driving. It grew every week, and the 90% band stays below zero the whole way. Anything that hit every market at once, like a sale or a seasonal dip, shows up in both groups and cancels out. A local event in the holdout markets alone would not.
The test measures PopSockets.com. Shoppers who skipped the site and bought on Amazon or in a store aren't in it.
The Outcome
After the Google read, PopSockets kept testing and moved the same holdout approach to other channels.
Stella's take: a clean result gets decided before launch. PopSockets' holdout markets already moved with the rest of the country before Google came off, and that's why a small holdout was enough for a read that holds up.
Every dollar carries an opportunity cost, so we optimize for incrementality, not platform-reported ROAS. Stella gives us a causal read on marginal return, so we know where the next dollar works hardest. That read covers the full portfolio: DTC, Amazon and retail, not just the channel the ad pointed to.
Jack Farrell, Vice President, Global E-Commerce at PopSockets
Method: 28 day inverse geo holdout in Stella, February 10 to March 9, 2026. Holdout DMAs were selected before launch based on historical correlation with the control markets. Google Ads came out of those markets while it kept running everywhere else, and the overall Google budget was reduced by the holdout's share. The counterfactual is a weighted synthetic control built from the control DMAs, trained on data from mid October through early February. The outcome was total revenue on PopSockets.com from first party sales data. Significance refers to the revenue effect; the iROAS interval is 90%. The $26.57K spend basis is what the holdout markets would have spent on Google, based on their spend before the test. Revenue, spend, and order counts are rounded; intervals, model fit, and significance are shown as reported. Results cover PopSockets.com revenue in the holdout markets during the 28 day test. Amazon, retail, longer run effects, and the return on additional spend were not measured.
A number you can move budget on beats a number you have to trust. See how Stella measures incrementality, or book a demo.