A Practitioner's Guide to Weighted Synthetic Control Methods for Incrementality Testing
Updated June 2026
The short version
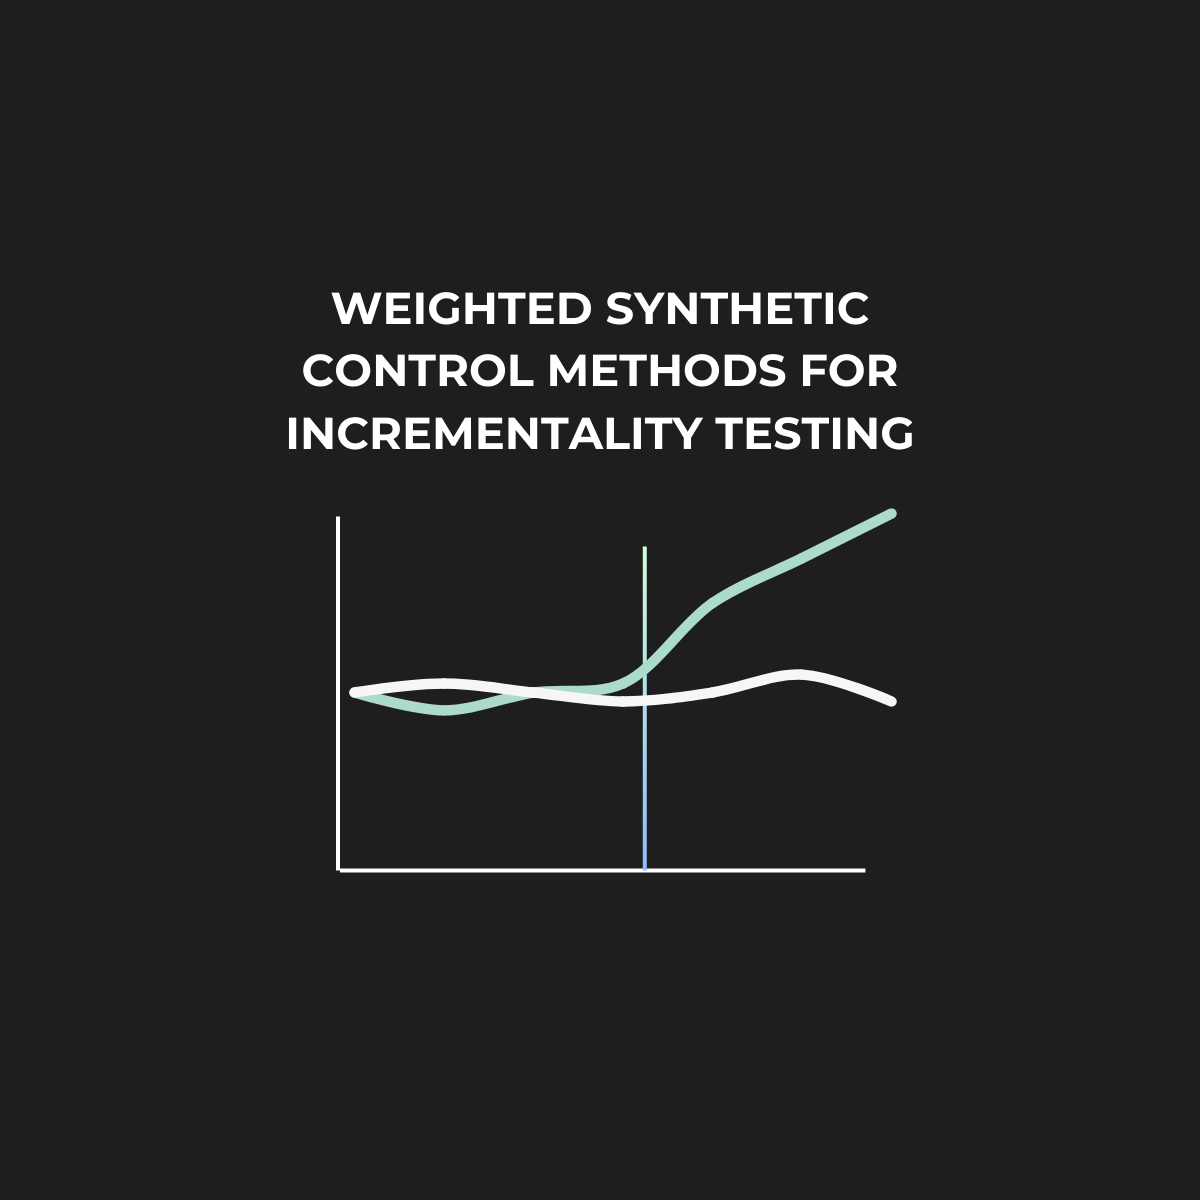
A weighted synthetic control is a custom benchmark for a test market. It blends several untreated markets into one that looked like your test market before the campaign, then uses that blend to estimate what would have happened without the campaign. The gap between actual sales and that benchmark is your estimated incremental lift.
The business question underneath the math is simple. Did the campaign create revenue, or did the platform just take credit for revenue that was already going to happen?
One number for context, since you'll want it: across 225 geo tests in Stella's own dataset, 88.4% reached at least 90% confidence, with a median incremental ROAS of 2.31x and an interquartile range of 1.36x to 3.24x. Treat that as a benchmark for tests that were viable enough to run, from a self-selected set of mostly DTC advertisers. It's not a universal success rate or a guarantee.
Weighted synthetic control is useful when a clean user-level A/B test isn't available, isn't trusted, or isn't practical. It's especially useful for geo tests across Meta, Google, CTV, podcast, and retail media, where user-level exposure is messy. But it isn't magic. It works only when the control markets are clean, the test market can actually be matched, and the diagnostics pass.
Why marketers need this in the first place
Most marketers already know platform ROAS isn't the same thing as incrementality. A dashboard can tell you which conversions were attributed to an ad. It can't tell you which conversions would have happened anyway. That's the difference between reported performance and causal performance.
Three measurement categories get mixed together, and they're not the same:
- Platform attribution is not causal. Last-click, view-through, and in-platform ROAS over-credit ads, because platforms optimize toward people who were already likely to buy.
- Platform lift tools, like Meta Lift and Google Conversion Lift, are more credible. They use randomized holdouts, so they're causal by design when set up right. They still carry platform-controlled methodology, eligibility limits, and black-box reporting.
- Geo incrementality tests give you an independent read you control. You create different exposure levels across markets, then compare what happened against what likely would have happened without the campaign.
Weighted synthetic control is one way to read that geo test. It doesn't replace good experimental design. It builds the best possible counterfactual once the test is designed.
How weighted synthetic control works
Start with a test market. Say you run a six-week campaign in Chicago. To measure incrementality, you need to estimate what Chicago sales would have been if the campaign had never run.
The bad version compares Chicago to one similar city. Detroit, maybe. One market almost never gives you a good enough match.
Weighted synthetic control uses a blend instead. The model might decide Chicago's best benchmark is 38% Detroit, 31% Minneapolis, 22% Cleveland, and 9% other markets. Those weights are chosen because that blend tracked Chicago's pre-campaign sales closely.
If the synthetic version of Chicago would have produced $1.0M during the test and actual Chicago sales were $1.08M, the estimated lift is $80K. That's not platform-attributed revenue. It's estimated incremental revenue, assuming the synthetic control is a credible counterfactual.
That last phrase matters. The math gives you an estimate. The diagnostics tell you whether the estimate deserves to be believed.
Simulated example
See a synthetic control build itself
Drag the lift slider to set what the campaign really did. Switch the donor pool to watch a good read fall apart.
Illustration with simulated weekly data, not a client result. A real test adds placebo inference and confidence intervals on top of the fit check shown here.
Why the weights matter
The weights are one of the biggest advantages of synthetic control. You can see which markets built the benchmark, which makes the method far easier to explain than a black-box model.
But readable does not mean valid. A synthetic control can look clean and still be fragile. If one donor carries most of the weight, a random shock in that donor moves your whole estimate. If the weights are spread thin across weak markets, the benchmark can be noisy.
The right question isn't "do the weights look reasonable." The right questions are:
- Did these donors actually match the test market before launch?
- Are any of them contaminated by media spillover?
- Does the result survive if one major donor is removed?
- Is the treated market inside the range the donors can recreate?
- Did the synthetic control predict data it wasn't trained on?
Weights create transparency. They don't replace validation.
The validation marketers should ask for
A synthetic control result should never be judged by pre-period fit alone. A high R-squared can mislead. It may only prove the model fit the past, and a model can overfit history and still fail the moment the campaign starts. Three checks matter.
Holdout validation
Before the campaign period is analyzed, test the model on pre-campaign data it didn't train on. Split the pre-period in two, train on the early weeks, then predict the later weeks. That later section is the holdout. If the model can't predict the holdout before the campaign, it has no business claiming lift after it. Good holdout performance doesn't prove causality. It earns the model the right to be taken seriously.
Placebo tests
Placebo tests ask one question: would this method find fake lift in markets where no campaign ran? Treat each donor as if it were the campaign market, apply the same method, and collect the "effects." Since those markets weren't treated, those effects map the false positives your design and model can produce, from noise, shocks, misspecification, or weak donor comparability. Then compare your real test market against that spread.
This produces a permutation-style pseudo p-value. With 32 placebo markets, the smallest possible one-sided p-value using the standard plus-one correction is 1/33 = 0.03, and that only happens if your result beats all 32. If it beats 31 of 32, the corrected p-value is 2/33 = 0.06. Small arithmetic matters here, because this is the number a technical reader checks first.
Simulated example
Is your result real, or just noise?
Each gray dot is a control market pretending it ran the campaign. None did, so their "lift" maps the false positives you'd see by chance. Drag your result and watch where it lands.
Illustration with simulated placebo effects, not a client result. One-sided pseudo p-value = (placebos at or above your result + 1) / (total placebos + 1).
Confidence intervals
A single lift number isn't enough. If the estimate says 6% but the range runs from -2% to 14%, the honest read is "inconclusive," not "the campaign worked." Show the estimate and the uncertainty around it. Finance doesn't need fake precision. It needs a range it can decide from.
What has to be true for this to work
Weighted synthetic control is credible only when a specific set of assumptions hold.
- The donor markets are genuinely untreated, not reached through spillover, leakage, overlapping DMAs, or national media.
- The test market is matchable, not too large, volatile, or structurally different from every donor.
- The test-to-donor relationship is stable, so a mid-campaign change affecting only the test market isn't mistaken for lift.
- Measurement is consistent across markets.
- The design was fixed before anyone looked at the result.
A clean-looking chart does not save a broken test.
When synthetic control breaks
It usually fails in predictable ways.
The test market is too extreme
Test in your biggest or weirdest market and the donor pool may not be able to recreate it. This isn't only about size, it's about support: the treated market has to sit inside the range the donors can express. If it doesn't, standard synthetic control hits the boundary and fits poorly. Augmented and regression methods extrapolate, which trades a fit problem for an extrapolation problem. The rule: don't pick test markets from the edge of your business without a good reason.
The controls are contaminated
This is the failure teams miss most. A control market only counts as untreated if it truly saw no campaign. CTV leaks across borders, paid social drifts, search demand spills, and retail media may not respect your test geography. Contaminated controls usually bias the estimate toward zero in a positive-lift test, so your campaign looks less incremental than it really was.
The pre-period is too short
Short histories create unstable weights and hide your seasonality. For businesses with annual seasonality, 52 or more weeks is often preferable. Faster-moving accounts can use shorter windows, but only if the donor relationships are stable and the holdout passes. More data isn't automatically better, old data goes stale, but too little makes the counterfactual fragile.
A shock hits during the test
A competitor sale, a warehouse issue, weather, or a holiday that behaves differently across markets can all bias the estimate. The model can't tell whether a market moved because of your campaign or because something else changed at the same time. External event checks aren't academic hygiene, they protect budget decisions from bad reads.
Synthetic control vs DiD vs BSTS vs MMM
No causal method is always right. Pick the one that fits your data shape.
| Method | Use it when | Main risk |
|---|---|---|
| Weighted synthetic controlAbadie, Diamond & Hainmueller (2010) | A few test markets, enough pre-period, good matching markets available | Treated market outside donor support; contaminated controls |
| Difference-in-differences | Treated and control markets plausibly satisfy parallel trends | Parallel-trends assumption fails and biases the estimate |
| BSTS / CausalImpactGoogle CausalImpact (Brodersen et al. 2015) | Strong predictive controls and stable structure | Counterfactual fails if controls are treated or relationships break |
| Augmented synthetic controlBen-Michael, Feller & Rothstein (2021) | Pre-period fit is close but not close enough | Extrapolation can push estimates past what the data supports |
Also cited in this guide: Gordon et al. (2019), on why observational exposed-versus-unexposed comparisons overstate true incremental lift.
For high-stakes decisions, one method is rarely enough. Run the main read, then use a second as a sensitivity check. Agreement across methods is reassuring, not proof, since two bad models can agree if they share the same bad data. But it convinces a skeptical CFO far more than any single number.
What to do with the iROAS
The point of incrementality testing isn't a prettier report. It's to change budget decisions. iROAS here is incremental revenue over media spend, which is a fine starting point, but finance will care about contribution margin, not revenue. A 2.5x revenue iROAS can be great for one business and weak for another depending on gross margin and payback.
| Result | Action |
|---|---|
| High platform ROAS + low iROAS | Investigate, then likely cap. The platform is claiming conversions that would have happened anyway, unless margin, LTV, or strategic value justify the spend. |
| Low platform ROAS + high iROAS | Lean in. This looks like an undercredited channel you've been under-investing in. Confirm with a follow-up test. |
| High iROAS + high volume | Scale, but in increments, and re-test at the higher spend. Today's iROAS is not your marginal ROAS, and auctions saturate. |
| Low iROAS + low volume | Reduce or kill, unless it serves a strategic or upper-funnel role you're measuring separately. |
| Inconclusive | Rerun with better market design, longer duration, or a more sensitive KPI. |
The worst outcome is running an incrementality test and changing nothing. Decide before launch what each result would make you do, then do it.
A checklist before you trust the result
Before you act on a synthetic control read, ask for this:
- The test and control market selection logic
- A list of excluded donor markets and why
- Pre-period fit and holdout validation
- Donor weights
- Leave-one-out sensitivity
- Placebo test distribution
- Corrected pseudo p-value
- Confidence interval or credible range
- Spillover and contamination review
- External event review
- iROAS translated into contribution-margin terms
If those pieces are missing, the result may be interesting. It isn't decision-grade yet.
Frequently asked questions
Is weighted synthetic control the same as a geo holdout?
No. A geo holdout is the design: you create different exposure or spend levels across markets. Weighted synthetic control is one way to analyze that design, turning untreated markets into a weighted benchmark instead of a simple average. The holdout creates the comparison, synthetic control improves the counterfactual.
How many control markets do I need?
There's no universal number. You need enough clean donors to create a good match and enough placebos to make inference meaningful. A pool of 20 to 40 untreated markets is often a healthy start, but quality matters more than raw count. One or two great matches can produce a good-looking benchmark with weak inference and high sensitivity risk.
How long should the test run?
Long enough to detect the effect you care about. A larger effect can be detected faster; a smaller one needs more time, more markets, cleaner controls, or a lower-variance KPI. Don't choose duration on business urgency alone. Choose it on minimum detectable effect and statistical power.
Can I use synthetic control if I ran the campaign everywhere?
Not cleanly. Synthetic control needs untreated markets. If every market got the campaign at once, there's no clean donor pool. For national, always-on spend, use media mix modeling, calibrated with experiments where possible.
Does a high R-squared mean the result is good?
No. A high pre-period R-squared only means the model fit history. It doesn't prove the counterfactual is valid. Confidence comes from the full design: clean controls, good holdout prediction, placebo tests, sensitivity checks, and no obvious confounding shock.
Technical notes
Weighted synthetic control identifies a causal effect only under a clear set of assumptions: untreated and uncontaminated donor markets, a treated market inside the donor pool's support, a treated-to-donor relationship that stays stable absent the campaign, no confounding shock coinciding with the test, consistent measurement across markets, and a design fixed before anyone sees post-period results. The estimate is a counterfactual under those assumptions, not a proof of causality on its own.
References and further reading:
- Abadie, Diamond & Hainmueller (2010), the canonical synthetic control method and placebo inference. https://www.tandfonline.com/doi/abs/10.1198/jasa.2009.ap08746
- Xu (2017), Generalized Synthetic Control, for multiple treated units and variable timing. https://doi.org/10.1017/pan.2016.2
- Ben-Michael, Feller & Rothstein (2021), the Augmented Synthetic Control Method. https://doi.org/10.1080/01621459.2021.1929245
- Arkhangelsky, Athey, Hirshberg, Imbens & Wager (2021), Synthetic Difference-in-Differences. https://doi.org/10.1257/aer.20190159
- Brodersen et al. (2015), Bayesian structural time series, the model behind Google CausalImpact. https://google.github.io/CausalImpact/
- Gordon, Zettelmeyer, Bhargava & Chapsky (2019), on observational versus experimental ad measurement at Facebook. https://pubsonline.informs.org/doi/10.1287/mksc.2018.1135
The bottom line
Weighted synthetic control answers the question platform dashboards can't: what would have happened if you hadn't spent the money? It isn't a magic causal machine. It's a disciplined way to build and validate a counterfactual when a clean user-level experiment isn't available.
When the donors are clean, the test market is matchable, the holdout fit is strong, the placebo result stands out, and the uncertainty range supports action, the estimate is defensible. When those checks fail, the answer isn't "the model says no lift." It's simpler: you don't have a test you can trust yet.
That distinction is the difference between incrementality theater and measurement a finance team can actually use.
Run your next campaign through Stella and see the number you can defend.