
How Do You Validate a Marketing Mix Model (MMM)? The Complete Guide
Validating an MMM is not about chasing perfect stats. It is about making sure your model is accurate, stable, causal, and believable.
.png)
Every marketer running an MMM eventually asks the same question: can I trust these results?
Done right, an MMM tells you which channels actually drive incremental revenue and which ones are coasting on attribution. Done wrong, two models built on the same dataset will tell you to do opposite things.
That is why validation matters. It is what turns an MMM from a black box of coefficients into something you can stake a budget on.
This guide covers everything you need to validate an MMM, whether you are running Robyn, Meridian, PyMC-Marketing, Stella, or anything else.
Quick MMM validation checklist
Run through this right after building a model. If most of these check out, your MMM is probably Here is the short list every marketer should run through right after building an MMM.
✅ R² between 0.7–0.95 (not too low, not suspiciously high)
✅ MAPE under 15–20% for weekly or monthly data
✅ VIF under 5 for all variables (caution if 5–10, bad if >10)
✅ Baseline between 25–70% of total sales (never negative)
✅ ROAS stability: Coefficients do not swing wildly between runs
✅ Plausible adstock: Half-lives under 100 days for digital, longer is fine for TV or OOH
✅ Residuals clean: No visible trends or seasonality in residual plots
✅ Response curves flatten: All channels show diminishing returns
✅ Out-of-sample error under 15%
Where do I find validation metrics in each platform?
Knowing where to look saves hours. Here is the cheat sheet.
- Credible intervals: posterior summary tables
- Diagnostics: trace plots, R-hat values (under 1.1 is good)
- Response curves: built-in adstock and saturation plots
- Diagnostics: az.summary() for R-hat and ESS
- Model comparison: WAIC or LOO
- Posterior predictive checks: az.plot_ppc()
- R², MAPE, and VIF surface in the dashboard automatically
- Out-of-sample charts auto-generated
- Budget and revenue optimization included by default
If you're new to Meridian specifically, the walkthrough in Getting Started with MMM Using Google Meridian covers setup, install, and the gotchas Google's docs gloss over.


Knowing where to look removes guesswork and ensures you are checking the right boxes in the right tool.
What metrics actually matter for MMM validation?
Three diagnostics carry most of the weight.
R² (goodness of fit). Measures how much sales variation the model explains. Below 0.7 means you're missing drivers. Above 0.95 usually means you're fitting noise.
MAPE (prediction error). Average forecast error. Under 20% means the model generalizes. Above 30% means something is fundamentally broken.
VIF (variance inflation factor). Catches multicollinearity. If VIF is over 10, the model can't tell which channel actually drove sales. The coefficients become arithmetic, not insight.
The lesson: don't chase one perfect number. Validation is about balance. The best MMM is the one with reasonable fit, low error, and no multicollinearity, not the one that maxes out R².
A scatter showing R² and MAPE combinations. The green zone is where trustworthy models live. Models with R² > 0.95 and MAPE < 5% are usually overfitting. Models with R² < 0.7 are underfitting.
Should I split platforms into separate variables?
Yes, but with discipline. Lumping hides signal. Endless splitting adds noise.
Take Google Ads. If you stuff Search, YouTube, Display, and PMax into one "Google" variable, you're telling the model they all behave the same. They don't. Splitting lets the model learn each channel's ROI and saturation curve.
Same logic for Meta. Prospecting and retargeting almost always have different effective ROAS.
Here's the nuance. The right split is the one that lowers VIF and produces curves that make business sense. Granularity isn't about detail. It's about clarity.
How do I keep MMM results consistent over time?
Validation isn't a one-time check. It's a monthly or quarterly habit.
Build a standard MMM template. Same column structure. Same controls. Same variable definitions. Rerun on a fixed cadence. When you compare models across time, you want the differences to come from reality, not from you redefining "Meta" mid-quarter.
When you do need to add a new channel or control, run the old and new versions in parallel for a cycle or two. Only adopt the new one if diagnostics improve meaningfully.
That's how an MMM goes from interesting output to trusted trendline. The IAB's Modernizing MMM Best Practices guide, released in December 2025, calls out the same principle: faster refresh cycles paired with discipline about when to retrain.
Can MMMs be validated against real-world experiments?
Yes, and they should be. Experiments are the gold standard of incrementality.
Geo holdouts, time-based pauses, and causal impact studies show what actually happens when ads turn on or off. The smartest teams take those results and feed them back into the MMM as Bayesian priors. The model isn't just trained on historical correlations. It's anchored in causal evidence.
This is the foundation of the Jin et al. 2017 Google paper that most modern Bayesian MMMs are built on. Use experiment results to calibrate priors, then let the model fill in the gaps where experiments aren't possible.
A few practical guides on the experiment side:
- Incrementality Testing Platforms: The Complete Guide
- Weighted Synthetic Controls for Incrementality Testing
- How to Conduct an Incrementality Study for Google Ads
MMMs and experiments aren't rivals. They're allies. The more your MMM learns from holdouts, the tighter its credible intervals get and the more trustworthy its budget recommendations become.
How does out-of-sample testing validate my MMM?
If your model can't predict the future, why would you trust it to allocate budget?
Out-of-sample testing is straightforward. Train on all but the last 3 to 6 months of data. Predict forward. A reliable MMM should land within 15% of actuals. If it doesn't, you're overfitting.
Another method: back-testing budget reallocations. If your MMM says "shift $100K from Search to YouTube," test it with a smaller version of that move. Did MER improve the way the model said it would? If yes, the MMM has earned a real decision. If no, the model needs work.
That's how an MMM becomes more than a dashboard. It becomes a decision engine.
What red flags mean I shouldn't trust my MMM?
Six patterns to watch for. Most are fixable.
Multicollinearity (VIF over 10). Channels aren't separable. The model can't tell them apart. Fix: Combine correlated variables, extend the data window, or add interaction terms.
Negative baseline. Baseline equals trend plus seasonality. It should never go below zero. Fix: Add macro controls (pricing, broader economic indicators), or set priors with a floor at zero.
Coefficient instability. If Search ROAS swings from 2x to 8x between runs with no real change in the data, the model is brittle. Fix: Increase regularization, simplify your splits, hunt for outliers.
Implausible adstock. A 200-day half-life for paid Search is not realistic. Fix: Constrain priors to ranges that make business sense.
Residual patterns. If residuals show trend or seasonality, you missed a control. Fix: Add seasonality terms or external demand indicators.
Straight-line response curves. Returns should always flatten at higher spend. Otherwise the model is telling you to spend infinite dollars. Fix: Refit with proper saturation functions (Hill, Michaelis-Menten, logistic).
Red flags aren't failures. They're invitations to refine the model.
Why do credible intervals matter more than point estimates?
Most MMMs hand you one number per channel. "YouTube ROI = 3.2x." That's misleading because reality is probabilistic.
The better MMMs give you credible intervals. Example:
- YouTube ROI: 3.2x (90% CI: 2.8 to 3.5)
- Facebook ROI: 3.1x (90% CI: 1.0 to 6.0)
On paper they look similar. In practice they're not even close. YouTube is a defensible budget call. Facebook is a guess.
The width of the interval is often more useful than the point estimate. A tight interval around 2.5x beats a wide interval around 3.5x almost every time, especially when you're moving real money.
This is where Bayesian MMMs (Robyn, Meridian, PyMC-Marketing, and Stella) earn their keep. If your MMM doesn't quantify uncertainty, you're seeing half the answer.
Two channels with nearly identical point estimates can have very different decision implications once you see the spread.
How does endogeneity break an MMM?
Endogeneity is the most subtle pitfall in MMM, and the most dangerous. It happens when the model confuses cause and effect.
Classic example: Black Friday sales spike naturally because of demand. The team responds by boosting paid Search to capture that demand. The MMM sees Search spend go up and sales go up at the same time, and credits Search for the entire lift.
The real driver was the holiday. Search just rode the wave.
The fix is layered:
- Add controls for seasonality, competitor activity, macro trends, and pricing.
- Use lagged spend variables to break the simultaneity.
- Calibrate with geo holdouts, where spend is randomized rather than reactive.
A model that doesn't address endogeneity isn't just inaccurate. It's pointing the wrong direction entirely.
Incrementality vs A/B tests vs MMM (quick reference)
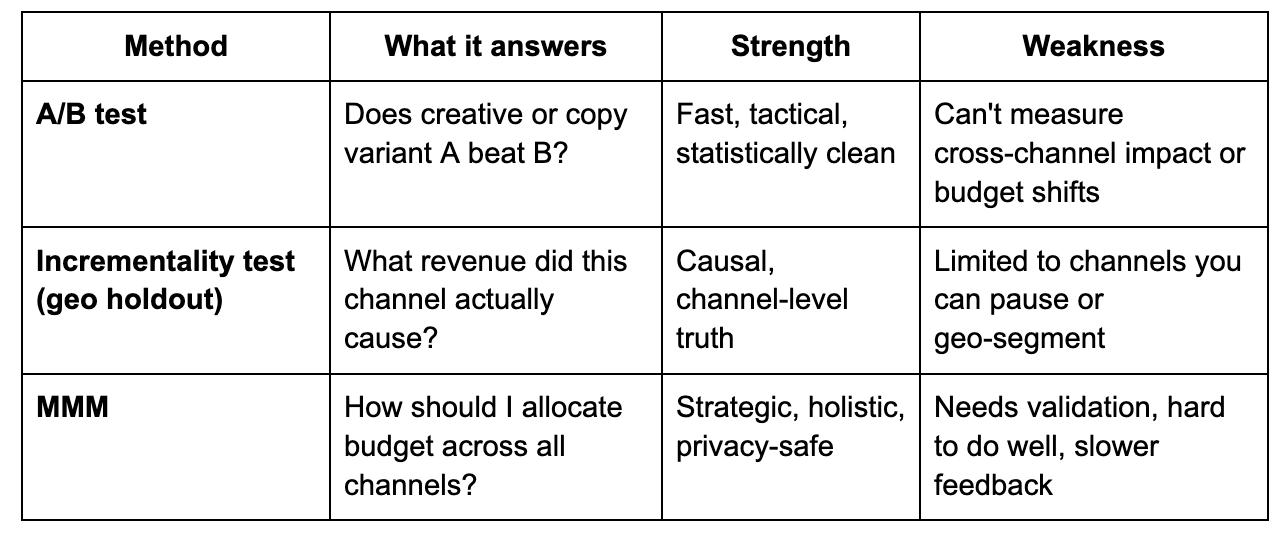
A modern measurement stack runs all three. MMM for the budget plan. Incrementality for channel truth. A/B for creative and tactical decisions.
How do I build long-term confidence in an MMM?
Validation is a loop, not a step. The MMMs that earn trust survive this cycle:
Phase 1 — Diagnostics. R², MAPE, VIF.
Phase 2 — Reality checks. Baseline share, contribution shape, response curves.
Phase 3 — Cross-validation. Holdouts, out-of-sample forecasts, budget back-tests.
Phase 4 — Iteration. New data, priors from experiments, monthly or quarterly reruns.
Over time, credible intervals tighten. Coefficients stabilize. Recommendations start proving themselves in MER and contribution margin. That is how MMMs earn trust, not in one run but across many.
Final takeaway
Validating an MMM is not about chasing perfect stats. It's about making sure your model is accurate, stable, causal, and believable.
- Use diagnostics (R², MAPE, VIF) to compare models
- Keep your template consistent across time
- Calibrate with experiments
- Watch for red flags and know how to fix them
- Trust the credible interval more than the point estimate
- Run the validation loop on a schedule
Do this and your MMM stops being an interesting output. It becomes a decision system you can stake a budget on.
Try Stella's MMM
If you want a Bayesian MMM that ships with diagnostics, out-of-sample charts, and experiment calibration built in, start a 7-day free trial of Stella. No credit card. Upload a CSV or Google Sheet and you're running.
%20(5).png)
.png)
%20(4).png)
.png)