Weighted Synthetic Controls for Incrementality Testing: The Complete Marketing Guide (2026)
The short version. A weighted synthetic control builds a custom twin of your test region from a blend of multiple untreated regions. The blend moves with your test group historically, so when the campaign runs, any gap between the two is the lift. This is how you get iROAS ranges tight enough to defend in a budget meeting instead of "somewhere between zero and seven."
Across 225 geo-based incrementality tests run on Stella between August 2024 and December 2025, the median iROAS was 2.31x. The interquartile range was 1.36x to 3.24x. 88.4 percent of tests reached statistical significance at 90 percent confidence. The single biggest predictor of whether a test was significant was not spend or duration. It was the quality of the synthetic control fit before the test even launched.
What is incrementality testing?
Incrementality testing answers one question. Would these sales have happened if the ads were off?
Most marketers still answer it with platform ROAS, which counts sales that would have happened anyway. That is how you end up with a 5x in-platform ROAS, pause the campaign, and watch only half the sales actually disappear. The other half was baseline.
That is not fraud. It is overlap, bad attribution windows, and no counterfactual. The fix is comparing a test group with ads to a control group without ads. The gap is the true lift. Google describes Conversion Lift the same way. Treatment, control, measure the difference.
Here is the catch most teams miss. Most incrementality tests do not fail because there was no lift. They fail because the control group was wrong.
Why do most incrementality tests fail?
The problem is not the math. It is the setup.
Random geo splits are an expensive coin toss
Some brands still pick half the states as test, half as control, and call it a study. That is not science. That is a coin toss with a media budget attached.
You cannot throw New York in one bucket and Nebraska in the other and expect them to behave the same way. Different demand curves, different consumer behavior, different economics. When the result swings wildly, you have no idea if it was the ads or the design.
Matched markets sound smart and still break
Pick two cities that look similar on paper, Denver and Austin, run ads in one and not the other. Reasonable, until real life intervenes.
A competitor runs a flash promo in one market. Weather tanks demand in the other. Inventory tightens in one and not the other. One random event blows up the entire test. You walk into the boardroom with a big iROAS swing and no way to defend it. That is how budgets get cut.
Weighted synthetic controls exist because the control group problem is the real problem.
What is a weighted synthetic control?
A weighted synthetic control builds a synthetic version of your test region. Instead of betting the entire study on one matched market, you create a weighted blend of multiple untreated regions that historically moved almost identically to your test group.
Oversimplified example:
- 40% Region A
- 30% Region B
- 30% Region C
Combined, that blend mirrors your test region's revenue pattern in the pre-period. When the campaign runs and the test region pulls away from the synthetic twin, the gap is your lift.
The method comes from Abadie, Diamond, and Hainmueller's 2010 paper, originally built to measure the impact of California's tobacco control program. It is the same statistical foundation behind Meta's open-source GeoLift library, which uses synthetic controls to run geo experiments at scale. For a deeper walk-through of the math, see Stella's practitioner's guide to weighted synthetic control methods.
The portfolio analogy holds. You would not bet your retirement on one stock. Traditional matched-market testing is exactly that. Weighted synthetic controls spread the bet across multiple correlated regions, so when one gets noisy the others smooth it out.
Range tightness
Why range width is the whole game
Two test designs can produce the same headline iROAS and tell completely different budget stories. Toggle the view to see why the spread matters more than the midpoint.
Illustrative ranges by methodology. Weighted synthetic control values reflect Stella's median range tightness across 225 geo tests, Aug 2024 to Dec 2025.
Why do weighted synthetic controls beat simple holdouts?
"Test minus control" math works in a lab. It rarely survives the real world.
A competitor runs a flash sale in your control region. Your lift looks inflated. Weather tanks demand in your test region. Your lift looks negative. Stockouts hit unevenly. The model falls apart.
Weighted synthetic controls fix this in three ways.
- They average out noise across multiple donor markets, so one anomaly does not swing the result.
- They tighten confidence intervals. Instead of [0.01, 7.0], you get something like [2.75, 4.25].
- They produce ranges you can act on. Not "could be zero, could be anything."
This is the difference between a study that survives CFO scrutiny and one that gets dismissed on the first slide.
When should you use weighted synthetic controls?
Not every test needs them. When the stakes are real, they are non-negotiable.
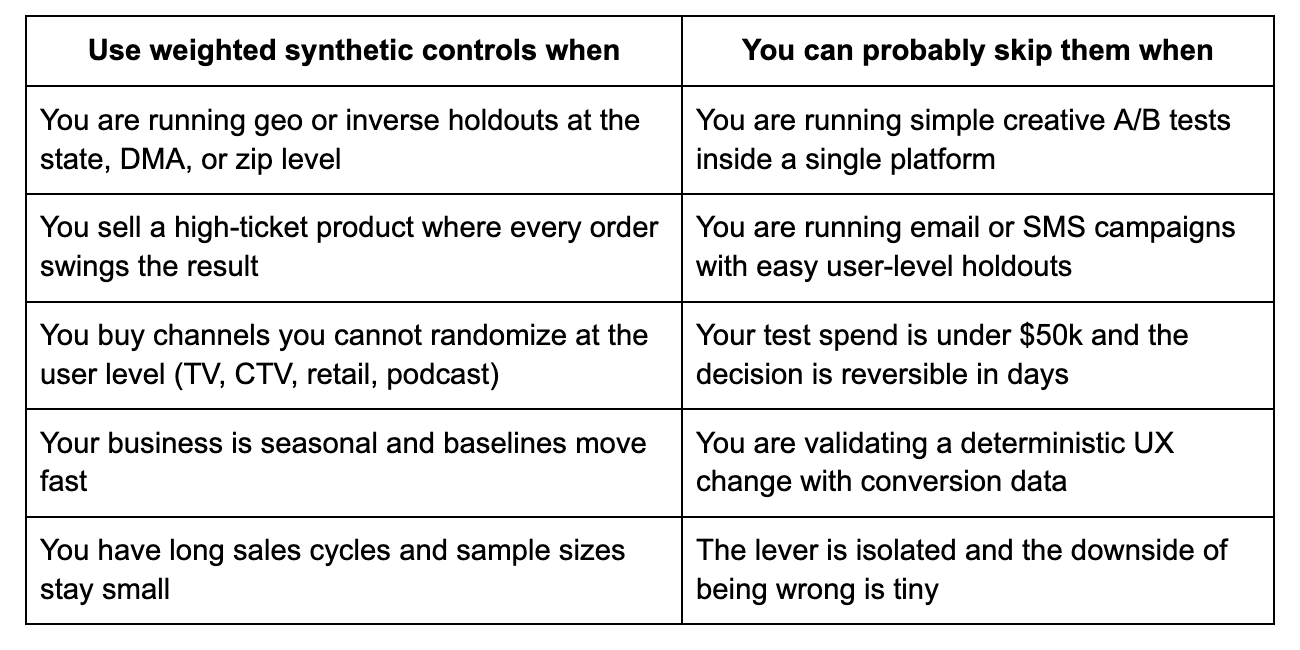
If you are moving millions in media spend and the decision will set next quarter's budget, do not run that test without synthetic controls.
How does Stella build its synthetic controls?
Most platforms throw every region into a weighted blender and call it a control group. That creates more noise, not less. A donor region with no historical relationship to your test region will pull the model around for no good reason.
Stella runs it in two steps.
Step 1: Correlation first
Before any weighting happens, Stella scans your historical regional revenue and finds regions that already move together. If two regions do not correlate over the lookback window, they get cut from the donor pool. Period. No exceptions for "but we want geographic coverage."
Step 2: Synthetic control second
Once the correlated pool is set, Stella layers weighted synthetic controls on top. The model picks the optimal weights inside the already-clean pool. That is why the resulting fit is so tight.
The benchmark backs this up. Across the 225-test dataset, pre-test fit quality was the single biggest predictor of whether a test reached statistical significance. Better donor selection upfront, fewer "inconclusive" results downstream. iROAS ranges from Stella tests tend to land at plus or minus 0.25 to 0.75 instead of the open-ended ranges that come out of single-stage models.
Benchmark distribution
Where the 225 tests actually landed
Most tests cluster between 1.5x and 3.0x iROAS. Toggle to filter for tests that hit 90 percent statistical significance and see how concentrated the defensible results really are.
Source: 2025 DTC Digital Advertising Incrementality Benchmarks.
How do you actually run one?
What you need
Last 120 days of revenue by region by date. A CSV or Google Sheet. That is it. No integrations, no pixel work, no tag setup.
The process
1. Open Stella's Incrementality tool and start the 7-day free trial.
2. Upload your data into the location selection step.
3. Wait 10 to 20 minutes for the model to run.
4. Review three split options.
The three options Stella returns:
- Minimum Investment. The cheapest valid design that still produces a defensible read.
- Highest Confidence. The tightest fit and the narrowest expected iROAS range.
- Happy Medium. A balance of both for teams that want a usable read without maxing spend.
Each option tells you which regions to test, which to hold, the minimum spend to hit power, and the expected confidence level. You see all of this before a single dollar of test budget runs.
What results do brands get?
Three real Stella tests. All of them used the correlated-pool plus weighted synthetic control setup above.
Ecom fashion brand. TikTok incrementality test returned a 2.1x iROAS inside a tight [1.7, 2.6] range. The team scaled TikTok spend 40 percent and drove an additional $800k in incremental revenue.
Healthcare brand. TV incrementality test revealed that 25 percent of the pipeline credited to TV was actually baseline demand, not lift. The team reallocated $300k out of TV and into higher-performing channels the following quarter.
CPG retail brand. Region-level synthetic controls showed promotional spend worked 30 percent better in urban markets than rural ones. The team adjusted the rollout and boosted overall promo iROAS by 18 percent.
For deeper benchmark cuts by channel, see the 2025 DTC Digital Advertising Incrementality Benchmarks and the 6-month podcast incrementality case study.
How does privacy change the math?
Short answer. It makes geo-based synthetic controls more important, not less. User-level attribution is degrading on every front, and geo testing sidesteps the whole problem.
App tracking has eroded
Apple's App Tracking Transparency lets users deny cross-app tracking. When they do, developers lose access to IDFA and the cross-app journey. User-level attribution becomes incomplete by default, and modeled data fills the gap.
The cookie deadline is gone, the direction is not
Google confirmed in April 2025 that Chrome will not introduce a separate cookie prompt, but third-party tracking restrictions continue to expand. Chrome Incognito already blocks third-party cookies by default. There is no single "cookie apocalypse date" anymore. The direction is still the same: less tracking, more modeling, more uncertainty in user-level reporting.
Why geo testing wins this fight
Geo-based incrementality with synthetic controls does not need user-level identifiers. It works on aggregate revenue by region by date. That makes it the most durable measurement method as the privacy stack keeps tightening. Every other method (MTA, pixel-based attribution, platform-reported lift) loses fidelity over time. Geo testing does not.
For the broader landscape of how this fits with attribution and media mix modeling, see Stella's 2025 guide to incrementality testing platforms.
What is the takeaway?
Every marketing decision is an investment decision. If your incrementality test spits out a range so wide it is meaningless, you are not running a study. You are rolling dice with a budget.
Weighted synthetic controls are how you turn inconclusive tests into confident, defensible reads. The math is real. The data is there. Across 225 Stella tests, 88.4 percent hit statistical significance because the donor pool was built right before the test ever went live.
Try Stella free for 7 days. Upload 120 days of revenue by region, and get three valid test designs back before you spend a dollar.