Tushy held linear TV out of its markets for 28 days. Revenue dropped where it went dark.

Tushy and Stella · Linear TV · Inverse geo holdout · 28-day test
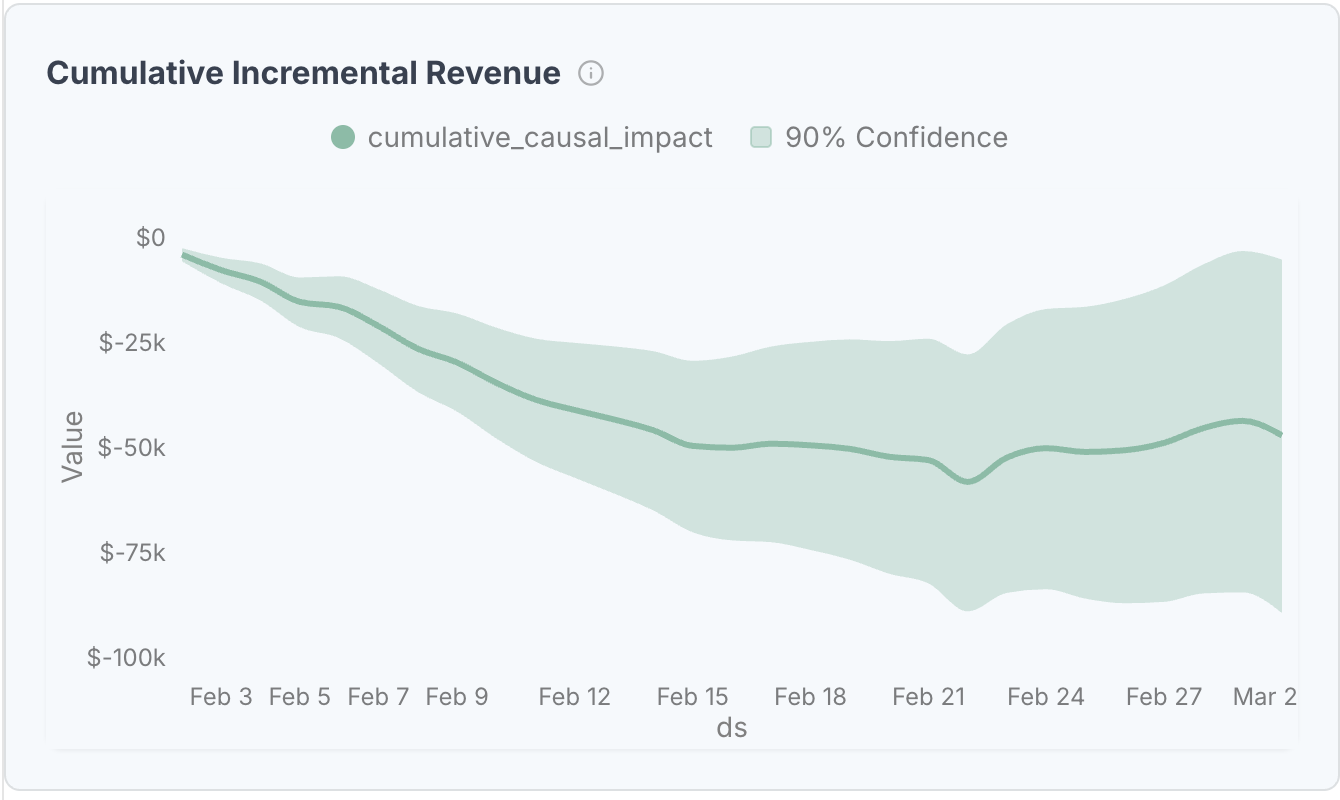
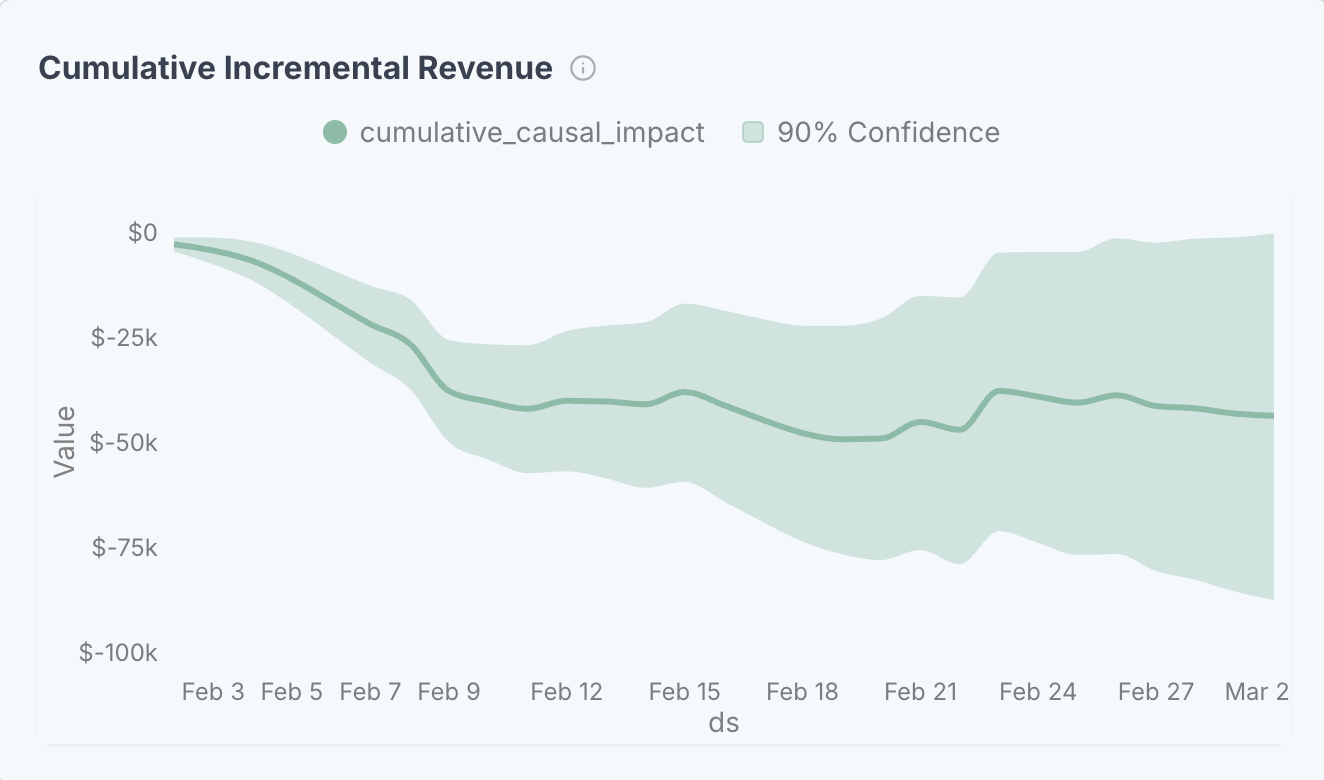
One inverse geo holdout, read across two storefronts. With TV removed, Amazon revenue came in an estimated 9.34% below its modeled counterfactual, about $47K over the test. Shopify showed a 9.17% estimated reduction in the same markets and window. Both effects met Stella's 90% significance threshold.
The Customer
Tushy is a direct to consumer bidet brand known for blunt marketing, selling modern bidet attachments, electric bidet seats, and related bathroom products through its own Shopify store and Amazon. Alongside its digital channels it runs linear TV, a channel with no click to trace.
The Problem
With no click to trace, TV falls out of last click attribution. When a Tushy ad sends someone to Amazon or Shopify days later, the storefront logs the sale and search takes the credit, while the ad that started the purchase leaves nothing either platform can read. That makes TV impossible to judge on the same terms as channels with tracked clicks and conversions. So Tushy asked the blunt version: what does revenue do when TV comes out?
The Test
Tushy ran a 28 day inverse geo holdout in Stella from February 3 to March 3, 2026. Linear TV kept running across the broader market and came out of a set of holdout regions chosen by a location analysis that matched them to that market. Stella modeled what those regions would have earned with TV still on, then compared it to what they actually did once TV was off. The difference is the estimated causal effect.
The one intervention was read against two outcomes, Amazon revenue and Shopify revenue, in the same markets and window. They are two reads of one experiment, not two experiments. The models tracked each revenue series closely before the holdout, R² 0.99 and 7.55% MAPE on Amazon, R² 0.98 and 9.11% on Shopify. Those are fit diagnostics; the causal read comes from pulling TV, not from the fit.
The Result
Amazon
Pulling TV cut Amazon revenue an estimated 9.34%, about $47K and 502 orders over the window, at 90% significance. Stella puts that at a 3.14x return on its $15K test basis, with a 90% interval of 0.36x to 5.95x. It is clear that TV drove incremental Amazon revenue, and much less clear how large the return was. The 3.14x is not a media ROAS: the $15K is Stella's computational test basis, not Tushy's aired TV spend.
Shopify
The same pull cut Shopify revenue an estimated 9.17%, about $44K and 298 orders, again at 90%. Stella reports a 2.91x effect on the same $15K basis, interval 0.02x to 5.82x. That lower bound almost on zero makes the Shopify number far less certain; the test reads direction more clearly than size. And because it came from the same holdout, Shopify moves with Amazon rather than confirming it on its own.
The Outcome
The holdout landed the same way on both storefronts. Revenue fell in the markets TV left, the revenue no storefront report would have traced back to TV. The test shows TV was incremental here. It does not fix the return on the next dollar, since the intervals are wide, Shopify especially, so a second holdout at a higher spend level is the way to map that.
Working with the team at Stella, we set out to figure out two things: (1) how can we measure the true impact of a channel like Linear TV beyond limited, clicks-based models, and (2) how can we quantify the lift across key sales channels like DTC and Amazon. The team was an amazing partner in both the test design and analysis, providing us with the clarity and confidence to not only adjust our media mix, but also reshape the way we think about Linear TV’s impact on our business holistically.
Jerel Blades, Head of Growth at TUSHY
Method: 28 day inverse geo holdout in Stella, February 3 to March 3, 2026, using custom test groups. Linear TV came out of a set of holdout regions selected by location match while it kept running across the broader market. One intervention was read against two outcomes, Amazon and Shopify revenue, at a 90% confidence threshold. Model fit before the holdout: Amazon R² 0.99, MAPE 7.55%; Shopify R² 0.98, MAPE 9.11%. Revenue and order counts are rounded; lift, intervals, model fit, and significance are shown as reported. The test basis is a computational basis, not Tushy's aired linear TV spend, so return figures are not media ROAS.
A number you can move budget on beats a number you have to trust. See how Stella measures incrementality, or book a demo.