How Rylee + Cru showed brand shopping ads drove revenue
Rylee + Cru, Red Blind Media and Stella · Google Brand Shopping · Geo inverse holdout · 20-day test
Rylee + Cru's Google Brand Shopping looked like the obvious cut. Brand terms are where platform ROAS overstates the most, so the efficiency playbook says trim there first. Red Blind Media tested it instead: pause the channel in 15 markets, hold it everywhere else, and measure the gap. Over 20 days the paused markets lost about $139K in net revenue against $21K of paused spend, a 6.57 incremental ROAS. The channel the playbook says to cut first was carrying real revenue.
The Customer
Rylee + Cru is a San Diego apparel brand founded in 2014 by illustrator Kelli Murray Larson. What began as art-forward clothing for her own kids has grown to span children's, teen, and women's, and now sits inside a small family of DTC labels, Quincy Mae, Play, and Noralee among them. Rylee + Cru's paid media and measurement run through Red Blind Media, a boutique agency that manages growth for 7 and 8 figure D2C brands and optimizes for contribution margin over platform ROAS. For a brand this size, a channel that looks like waste is the first thing on the chopping block, so the agency has to be right about which channels are actually waste before it cuts them.
The Problem
Platform-reported ROAS is where every media team has to start, and in the Google UI, Brand Shopping looked strong. But brand terms are where platform ROAS is least reliable, because the intent is already there. Someone typing "rylee and cru" into Google already means to buy, and when a shopping ad catches that click, Google books the sale as ad-driven even when the shopper would have arrived through organic or direct anyway. The standard efficiency playbook says cut brand first for exactly this reason. Red Blind knew all of this, and that is exactly why they weren't going to pull spend off a live channel on a hunch. What they needed was a way to separate the revenue Brand Shopping was causing from the revenue it was only being credited for, before they touched the budget.
The Test
Red Blind ran a geo inverse holdout in Stella on the Google Brand Shopping campaign over a 20 day window in late May and early June 2026. Rather than trust attribution, they paused Brand Shopping in a 30% holdout, the "happy medium" split: 15 test markets including Texas, Florida, North Carolina, Ohio, and Oregon, with the remaining states and DC left as control. Stella built the counterfactual from the control geos: given how test and control moved together before the pause, what the paused markets would have earned if nothing had changed.
The pre period fit was strong. Test and control tracked closely beforehand, with a correlation of 0.97, an R² of 0.9, and a MAPE of 9.38%, and a CUSUM p-value of 0.506 found no evidence of a structural break heading into the test. Those are fit and stability diagnostics, not proof of causation. They say the counterfactual is a credible stand-in for the paused markets and that the pre period gave no reason to distrust the match. The estimate still rests on the design's assumptions: that nothing hit the test markets differently from control during the window, and that demand did not leak between them. The design could detect a lift as small as 11.5% at 80% power, so at roughly four times that, the effect was well inside what the test was built to catch.
The Result
On the exact dashboard figures, pausing Brand Shopping reduced net revenue in the test markets by about $139K over the 20 days, against roughly $21K of paused spend. That is an incremental ROAS of 6.57, an incremental cost per order near $23, and about 910 incremental orders. Measured against the counterfactual, net revenue in the paused markets ran 48.78% below expected. The 6.57 is computed on the unrounded 138.77K and 21.12K; the rounded figures above divide to about 6.6.
The effect holds up to pressure. Under Stella's inference it was distinguishable from zero at the 1% level, and the iROAS interval ran from 4.73 to 8.30, shown on the dashboard as -8.30 to -4.73 on the pause-effect scale. Even at the conservative end, each dollar of Brand Shopping spend was associated with about $4.73 of incremental net revenue. The control markets net out shocks that hit both groups the same way, a sitewide promotion or a seasonal swing, so the gap is hard to explain as ordinary timing. What the design cannot rule out is an event that hit the test markets alone, or demand leaking between test and control.
The cumulative impact was still widening on the last day rather than leveling off. That means the effect had not settled by the end of the window, not that $139K is a floor. After 20 days the lost revenue could keep compounding, or some of it could return through other channels. That is outside what this test measured.
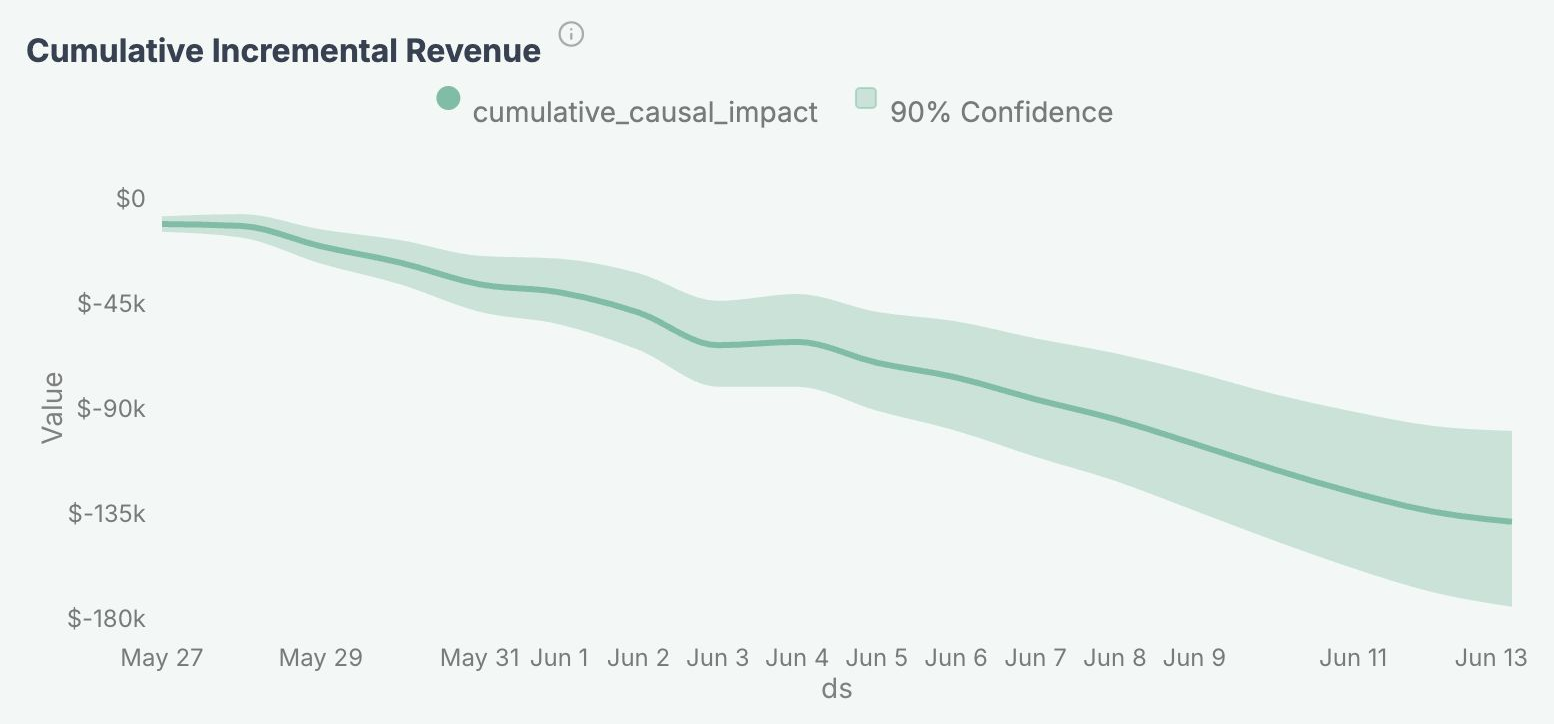
At the market level, the revenue did not come back inside the window: net revenue in the paused markets fell and stayed below the counterfactual. The test measures whole-market revenue, so it cannot follow individual shoppers or say where any one person's demand went. What it shows is that, in aggregate, the paused markets did not recover the revenue while the ads were off.
So within these markets and this window, the channel the playbook says to cut first was strongly incremental. Platform ROAS had been directionally right that Brand Shopping mattered. What it could not do was size the contribution. The holdout did, with an interval around it, so Red Blind had a number it could take to the client and defend. This is a result about these geos, this spend level, and these three weeks, not a claim that Brand Shopping returns 6.57 at every budget or in every season.
Why It Was Incremental
The usual reflex is that brand traffic is already yours, so paying to catch it taxes demand you would have won anyway. Red Blind's read on why that isn't true for Rylee + Cru comes down to how apparel gets bought.
People shop the look. Someone who types "rylee and cru" is not always locked onto Rylee + Cru. They are picturing a style. On the shopping results, competitors bid into that same branded query and show their own attractive pieces right next to the brand's. With no Brand Shopping ad holding that space, some of that intent gets siphoned to whoever shows the better-looking item. So the spend is defending demand that is still up for grabs, not buying back sales that were already coming.
Red Blind sees the mirror image of this in their nonbrand campaign, where conquesting competitors' terms, bidding on other brands' names, wins real sales. If Rylee + Cru can pull buyers off a competitor's branded search, competitors can do the same in reverse. In a category where buyers are open to switching at the moment of intent, that spend is doing real defensive work. The holdout measured the size of the effect. This is Red Blind's read on why it is there.
The Outcome
Even at the conservative 4.73 end of the range, Brand Shopping covers its ad cost as long as Rylee + Cru keeps more than about 21% of each incremental revenue dollar after variable costs, since 1 divided by 4.73 is 21.1%. Whether it clears that bar depends on their real contribution margin, product cost, shipping, payment fees, discounts, and returns included, which is a number for their books rather than this test. On Red Blind's recommendation, Rylee + Cru held Brand Shopping in place and moved to sizing it against the tested return rather than platform ROAS.
The more durable outcome was the method. A channel Red Blind had every reason to treat as a safe cut was carrying real revenue, and the only way to know was to test what happened when it stopped rather than read it off a dashboard. That test is now the one they run before trimming anything that looks obvious.
A number you can move budget on beats a number you have to trust. See how Stella measures incrementality, or book a demo.