How incremental are podcast ads? A 3-month DTC case study
Probably more than the promo codes showed. Across three windows from February to April 2025, our models estimated that a DTC brand's podcast sponsorships drove $175,890 in incremental revenue on $75,520 of spend. That's a blended incremental ROAS (iROAS) of 2.33. The brand's promo-code reporting put podcast ROAS at 1.0 to 1.5. February and March were stronger. April was close to break-even.
iROAS here is model-estimated incremental revenue divided by spend: $175,890 / $75,520 = 2.33. Incremental revenue is what the models estimate would not have happened without podcasts. Nobody counted those sales one by one.
So the honest headline is narrower than "podcasts work." The models suggest podcasts were doing more than promo codes credited them for. For this brand, that made a stronger test worth running before any big budget move.
Were promo codes enough to judge podcasts?
Probably not. Promo codes only count buyers who remember the code and type it in. A listener who hears an ad, then searches the brand or buys weeks later, gets credited to search, direct, or nothing. Codes can also pick up buyers who would have purchased anyway. So 1.0 to 1.5 tells you what the codes captured. It doesn't tell you what podcasts caused.
Our client is an ecommerce brand that runs most of its paid media on Meta and Google. In 2024 and 2025 it added podcast sponsorships on shows including Meidas Touch, Some More News, Steve-O's Wild Ride, and The H3 Podcast. Its promo-code reporting put podcast ROAS at 1.0 to 1.5, which made the channel look marginal.
We wanted to know whether that number was missing something, and how sure we could be about it.
How do you measure podcast incrementality without a holdout?
You model it. These were national host-read placements, so there was no clean way to hold out a region. Instead, models learned how daily revenue moved with Meta, Google, and TikTok spend, promotions, seasonality, and organic demand. Then they forecast revenue without the podcast effect. The gap between that forecast and actual revenue is the estimated incremental revenue.
This wasn't a randomized experiment. We used observational time-series models to estimate what revenue might have looked like without podcasts. That estimate depends on the quality of the counterfactual, and on whether the models adequately account for everything else affecting sales. Strong historical fit helps, but it doesn't establish causality on its own.
Several shows also aired on the same days, so we measured all podcast spend together, as one program.
The analysis modeled daily revenue and daily orders, using 120 days of training data before the test windows. Podcasts went in as daily spend plus a yes-or-no flag for air days. We compared results across Bayesian structural time series (the approach behind Brodersen et al., 2015), temporal regression, and synthetic control approaches.
The analysis also reported these diagnostics:
- Fit error (MAPE). Mean absolute percentage error is how far, on an average day, the forecast missed actual revenue in the training period. Lower is better. It describes daily fit in training, which is a different thing from how uncertain a cumulative lift estimate is.
- Posterior predictive checks. These test whether the model can reproduce the revenue data it learned from. A model that can't isn't worth forecasting with.
- Placebo checks. We shifted podcast activity to alternative dates and re-ran the models, and reported no comparable lift.
- Significance level. The model output marks each window as significant or not at 90%, 95%, and 99%. We used 90%, a looser bar than the 95% many analysts default to. We report all three so you can hold the results to the stricter one.
These checks can help flag model sensitivity and implausible results. They don't eliminate the possibility of unobserved confounding. The original analysis also didn't record enough detail for an independent review: no per-model estimates, no placebo distribution, and no description of the test behind the significance flags. So read the methods as what we ran, and the screenshots below as what we can show.
What did the podcast incrementality results show?
The model flagged all three windows as significant at 90%. None reached 95%. February came in at 2.89 iROAS, March at 2.64, and April at 1.21. Combined, $175,890 of estimated incremental revenue on $75,520 of spend works out to 2.33. In each window, podcasts added 2% to 10% over what the forecast expected.
| Window | Spend | Incremental revenue | iROAS | Incremental orders | Lift vs forecast | Pre-period error (MAPE) |
|---|---|---|---|---|---|---|
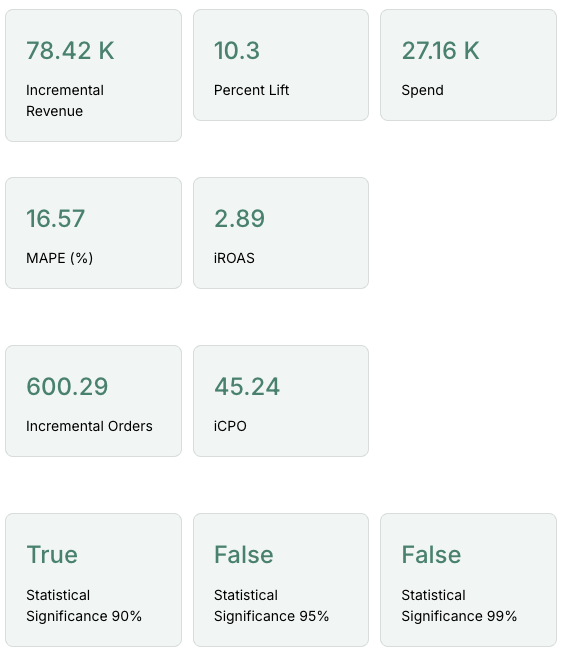
| February 2025 | $27,160 | $78,420 | 2.89 | 600 | 10.3% | 16.57% |
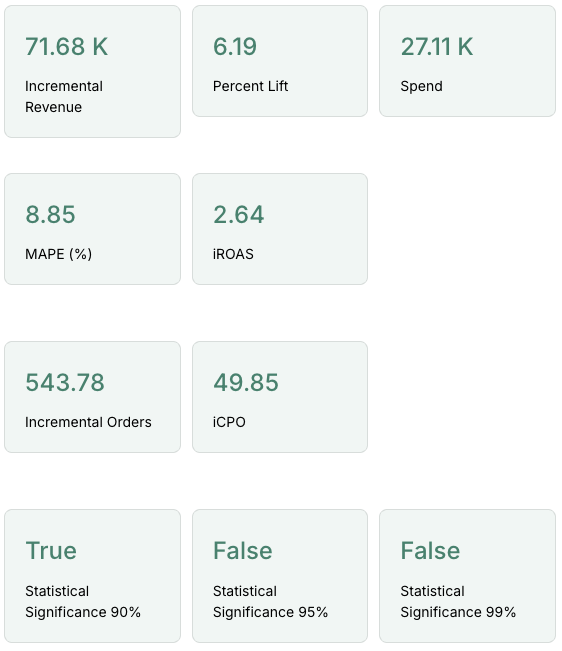
| March 2025 | $27,110 | $71,680 | 2.64 | 543 | 6.19% | 8.85% |
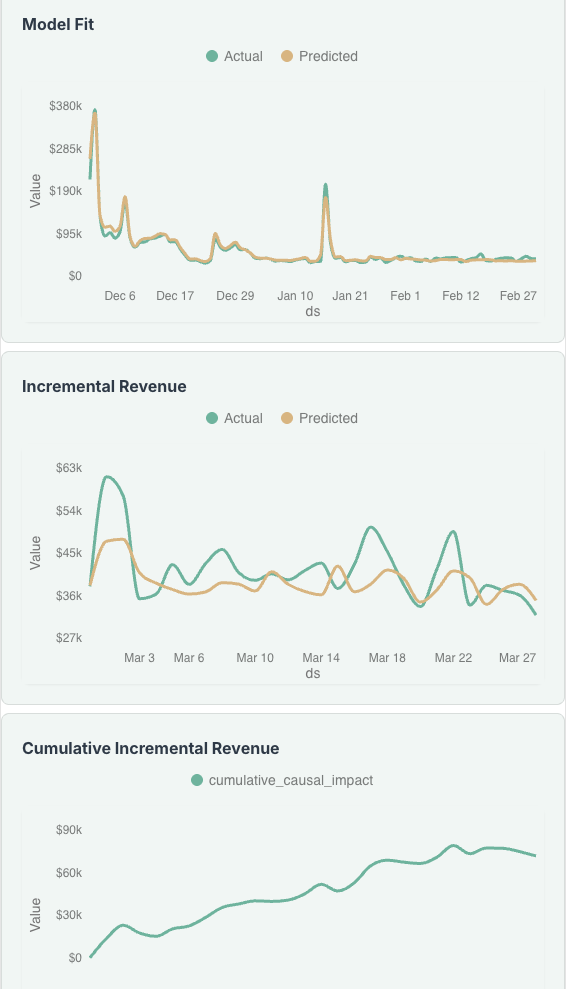
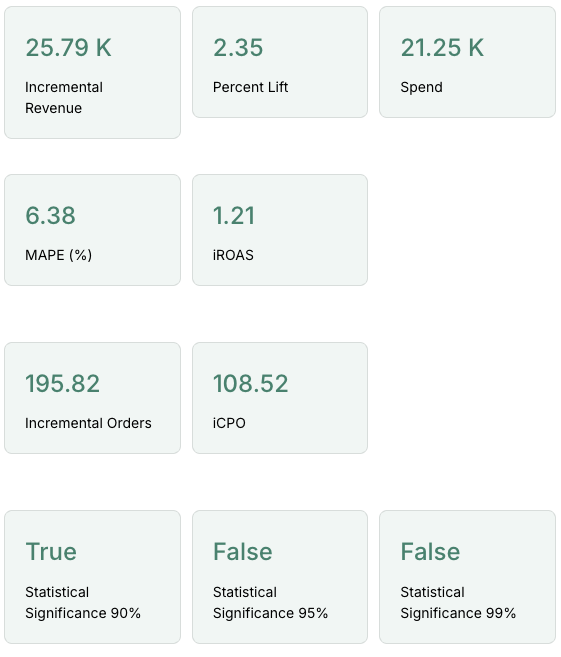
| April 2025 | $21,250 | $25,790 | 1.21 | 195 | 2.35% | 6.38% |
| Total | $75,520 | $175,890 | 2.33 | 1,338 | n/a | n/a |
Lift vs forecast is incremental revenue as a share of what the model expected without podcasts. Each monthly figure comes from the model outputs shown in the screenshots below. The total row adds them up.
2.33 against 1.0 to 1.5 is a big gap. It's also built from three windows that don't deserve equal weight.
| Window | What looks good | What a skeptic should push on | How we read it |
|---|---|---|---|
| February | Biggest lift, 2.89 iROAS | Highest pre-period error (16.57%) | Encouraging, precision unknown |
| March | Running total climbed steadily, 8.85% pre-period error | Only flagged at 90%, not 95% | Most consistent modeled signal |
| April | Best fit (6.38%) | Running total below zero until the final week | Not a stable read either way |
What are the limits of these results?
Each window has its own problem. January was confounded and thrown out. February had the weakest training fit. April only turned positive in its last week. And this is one brand over three months, so it says little about podcasts in general.
February: highest return, weakest fit
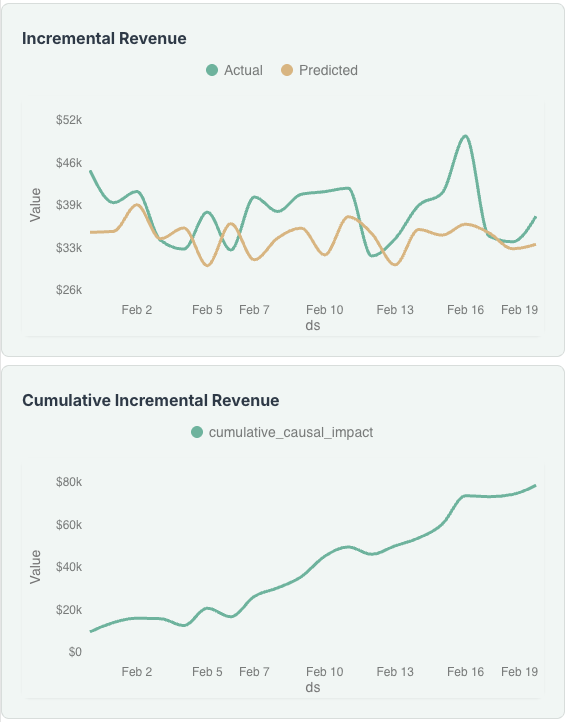
February produced the highest estimated return at 2.89 iROAS, alongside the highest reported pre-period MAPE at 16.57%. That raises questions about forecast reliability. But training-period error alone doesn't tell us how uncertain the cumulative incremental revenue estimate is. February's result is encouraging, though the available diagnostics aren't enough to establish how precise it is.
March: a more consistent modeled signal
March's model estimated $71,680 in incremental revenue, equivalent to 2.64 iROAS. Its cumulative estimate rose fairly steadily through the month, with a reported pre-period MAPE of 8.85%. The result was flagged as significant at 90%, but not 95%. The pattern is encouraging, though neither the trajectory nor the training fit establishes the causal effect on its own.
April: unstable, and we don't know why
April's modeled return fell to 1.21 iROAS, compared with 2.89 in February and 2.64 in March. The running total of incremental revenue sat below zero for most of the month and only turned positive in the final week, as the chart below shows. The reported significance applies to the complete measurement window, not to each day or week. Because the estimate changed direction late in the period, it shouldn't be read as evidence of consistently positive performance through April.
The available analysis can't establish why the effect differed across months. That's exactly why one month of modeled performance should not be treated as a stable estimate of what a channel does.
January: confounded, so excluded
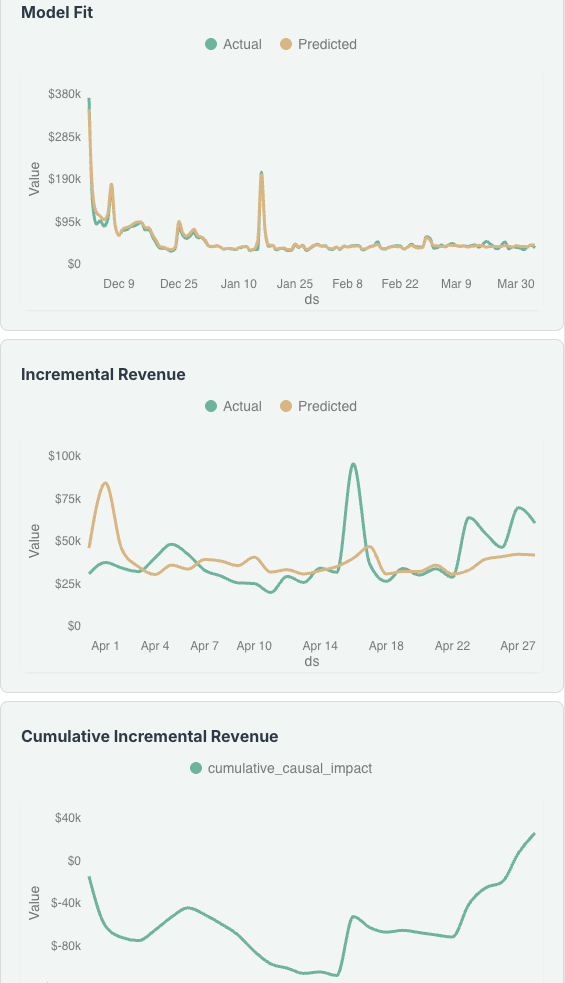
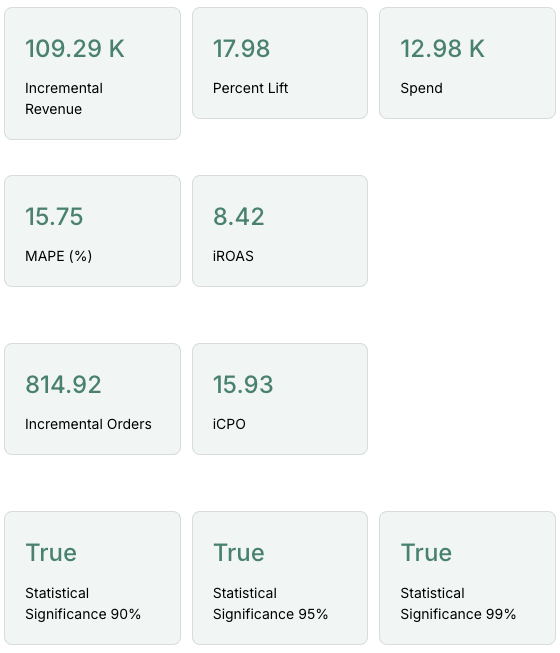
January's model estimated an 8.42 iROAS ($109,290 of incremental revenue on $12,980 of spend). But a major promotion and overlapping sponsorships made it hard to isolate the podcast contribution. We excluded this window from the reported results rather than treat a potentially confounded estimate as evidence of exceptional performance. It's not in any total on this page.
What should a brand do with a 2.33 iROAS?
Treat it as a reason to measure better before spending more. The analysis suggested podcasts may be contributing more revenue than promo-code attribution alone indicated. For this brand, that made a stronger measurement design worth pursuing before any major budget decision.
A few things the 2.33 doesn't tell you. It's the average return on all podcast spend in those windows. The next dollar usually earns less, which is why average and marginal iROAS differ. It's revenue, so whether podcasts made money depends on gross margin. And since shows overlapped, it can't rank individual shows.
The next step we recommended was a design with sharper contrast than steady spend: after a sustained run, go dark for a month, or pause for three months and then run one heavy month. Bigger swings in spend give the models a stronger signal to work with. Those designs still are not randomized, so they would sharpen the estimate without settling it. Where a randomized holdout is possible, it's the stronger design, and Stella runs both kinds of incrementality tests.
Frequently asked questions
Can you measure podcast ad incrementality without a geo holdout?
Yes, with more uncertainty. When a host-read ad airs nationally there's no region to hold out, so you model what revenue might have looked like without podcasts and compare it to what happened. The result depends on how well the models separate podcasts from everything else driving sales.
Why not just measure podcasts with promo codes?
Promo codes only count buyers who remember the code and type it in. Listeners who hear an ad, then search the brand or buy weeks later, never show up. Codes can also pick up buyers who would have purchased anyway. In this case codes credited podcasts with 1.0 to 1.5 ROAS, while the models estimated 2.33.
Is 90% confidence enough to make a budget decision?
It depends on the decision. A result flagged at 90% is weaker statistical evidence than one that meets a 95% threshold, and neither threshold rules out model bias. We'd not use these results alone to justify a major budget increase. The right next step depends on contribution margin, the cost of further testing, and how much uncertainty the brand can tolerate.
Why was April's podcast result so much lower?
The analysis can't say. April's running total of incremental revenue sat below zero for most of the month and only turned positive in the final week. On its own, one month like that doesn't mean podcasts stopped working.
Does a 2.33 iROAS mean podcasts are profitable?
Not on its own. iROAS is incremental revenue divided by spend, so it ignores margin. Whether 2.33 makes money depends on gross margin and repeat purchase. It's also an average across all podcast spend, so it doesn't tell you the return on the next dollar or on any single show.
Which podcast show drove the most incremental revenue?
This study can't say. Several shows often aired on the same day, so their effects overlap in the data. The models measured the combined effect of all podcast spend. Comparing shows needs either separated air dates or a per-show signal such as promo codes, used for ranking rather than sizing.
Promo codes miss a lot of what sells outside a direct-response path. One month of modeling can mislead too. If either is the main evidence for or against your podcast budget, book a demo and we'll show you how we'd measure it on your data.