
How to Run a Google Ads Incrementality Study
Run a Google Ads incrementality study using geo holdouts, Conversion Lift, or Meridian GeoX from r eal benchmarks from 225 tests
.png)
Executive Summary
A Google Ads incrementality study measures the revenue your ads actually caused, not the revenue Google's platform credited them for. You run it by comparing markets that get ads to markets that do not, then calculating the lift, the incremental revenue, and the iROAS.
Across 225 geo-based tests on Stella's platform between August 2024 and December 2025, the median iROAS was 2.31x, with 88.4% of tests reaching statistical significance. Most teams discover their iROAS is meaningfully different from platform ROAS, often by 30-70%.
Your three options: Google's native Conversion Lift based on geography, a manual geo holdout, or a platform-supported holdout tied to backend revenue. The best fit depends on your account eligibility, your data setup, and whether the answer needs to feed an MMM.
What is a Google Ads incrementality study?
A Google Ads incrementality study is an experiment that measures how many conversions, orders, or dollars in revenue were caused by your campaigns, not just credited to them.
Google defines incrementality experiments as a way to measure the causal impact of ads at a specific point in time. The mechanic is the same across every flavor of test: split an audience or geography into treatment and control, run ads in one group, withhold or reduce them in the other, and measure the gap.
That gap is your counterfactual estimate. You never see the counterfactual directly. You estimate it using a control group, matched geographies, or a statistical model.
Real questions an incrementality study answers:
- Did Google Ads create new orders, or take credit for orders that were happening anyway?
- Is Performance Max actually driving incremental revenue?
- Is branded search protecting revenue, or capturing customers who were going to buy regardless?
- Should we increase, reduce, or move this budget?
Attribution measures credit. Incrementality measures causality. Most marketers use both. Few separate them clearly.
Why does incrementality matter for Google Ads?
Google Ads reporting was not built to be a neutral measurement system. It was built to report campaign performance inside Google's own platform.
A campaign can show strong platform ROAS while producing weak incremental impact. This usually happens when ads capture existing demand instead of creating new demand. Branded search is the cleanest example. A customer searches your brand, clicks the ad, buys, and Google records the conversion. The harder question is whether they would have bought without the ad. Sometimes the honest answer is yes.
That does not mean branded search is wasteful. It can defend against competitors. It can protect conversion paths. But you only know the real value if you measure it. Google itself now positions incrementality as part of a broader measurement system alongside attribution and MMM, with Meridian (its open-source MMM) designed to integrate experiment results as priors. Google previewed Meridian GeoX in May 2026, an open-source geo experimentation layer built to feed causal signals directly into MMM.
The reason to run the study is not to generate another report. It is to make better budget decisions.
Attribution vs incrementality: what's the difference?
Attribution tells you which campaign got credit for a conversion. Incrementality tells you whether that conversion happened because of the campaign.
Platform attribution operates inside the platform's view of the customer journey. If a user clicks a Google ad before buying, Google can attribute the sale to that campaign. The click does not prove the ad caused the sale.
Here is a typical example. A brand spends $50,000 on Google Ads. Google reports $250,000 in attributed revenue, a 5x platform ROAS. The brand runs a geo holdout. The study finds that only $100,000 of that revenue was incremental. iROAS comes in at 2x.
The campaign may still be profitable. But the decision changes. At 5x, the team scales aggressively. At 2x, they need to check margin, payback period, and whether the next dollar performs as well. In a Stella case study with a $17M athletic apparel brand, the gap went the other way. Platform reported 6.0 ROAS, but incrementality testing showed Google Ads was actually generating 67% more revenue than reported, which let the brand scale spend with confidence.
Both directions matter. Incrementality is not always bad news.
How does a Google Ads geo holdout study work?
A geo holdout study compares performance across geographic regions. Some regions keep getting ads. Others are held out, meaning ads are paused, reduced, or excluded. The difference in outcomes between the two groups estimates incremental impact.
Google Research has supported this approach since 2011 as a way to measure ad effectiveness through randomized geographic assignment. The methodology has matured significantly since, with trimmed match designs and synthetic control approaches now standard.
A basic Google Ads geo holdout looks like this:
- Choose comparable regions
- Assign some to treatment, some to control
- Keep ads active in treatment regions
- Pause or exclude ads in control regions
- Measure conversions, revenue, or orders by region
- Compare the treatment group against the estimated counterfactual
- Calculate lift, incremental revenue, and iROAS
The strength of this design is that it does not depend on platform attribution. You can tie it directly to Shopify, Amazon, retail, CRM, or offline conversion data.
The weakness is that geography is messy. Regions differ in population, demand, seasonality, competitive intensity, and customer mix. If treatment and control are not comparable, the result is misleading. Region selection is where most tests are won or lost.
What is an inverse holdout study?
An inverse holdout flips the structure. Instead of launching ads in test markets, you remove ads from regions where they currently run.
This is useful when a campaign is already live and you want to know whether the existing spend is producing incremental value.
Example: a brand runs Google Ads nationally. To test incrementality, it pauses Google Ads in a group of selected regions while keeping ads active everywhere else. If revenue drops in the paused regions compared with similar active regions, the ads were contributing incremental revenue.
You will see older content say "negative lift is good" for inverse holdouts. That framing is confusing and not always correct. The cleaner way to think about it: the study estimates the business impact of changing ad exposure. The sign of the result only makes sense in context of the design.
Which test should you actually run?
Not every question needs the same kind of test. Here is how to match the question to the design:
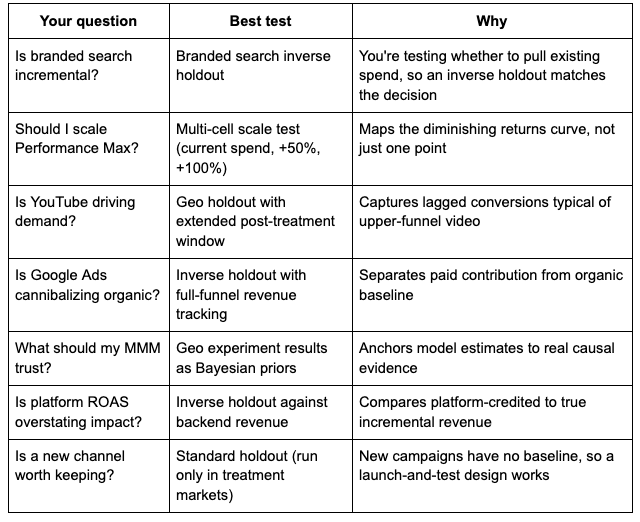
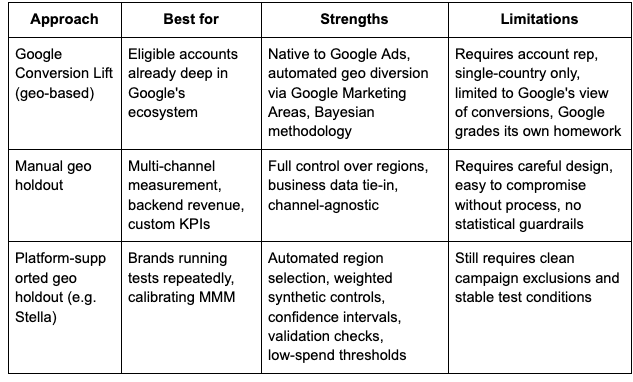
Should you use Conversion Lift or a manual geo holdout?
Use Google's native Conversion Lift based on geography if your account is eligible and the question fits.
Google's geo-based Conversion Lift supports App, Demand Gen, Discovery, Display, Video, Search, Shopping, and Performance Max campaigns, but it is not available for every account and generally requires working with a Google account representative. Campaigns must target a single country to be eligible for the geo-split methodology. Supported conversion inputs include the Google Ads conversion tag, Firebase, DV360 Floodlight, and offline conversion data aggregated to ZIP or city level.
A manual or platform-supported geo holdout is better when:
- Your account is not eligible for native lift tools
- You need backend revenue (Shopify, Amazon, retail) instead of only platform conversions
- You want full control over region selection
- The result needs to feed into broader measurement, like MMM or always-on incrementality
- You want a publisher-agnostic measurement source rather than relying on Google to grade itself
How do you choose the right geographies?
The quality of a geo holdout lives or dies on the geography split. You are trying to build two groups of regions that would have behaved similarly without the experiment.
Good matching considers historical revenue, conversion volume, traffic, population, customer mix, seasonality, average order value, prior media spend, regional volatility, and obvious outliers.
The goal is not identical regions. Identical regions almost never exist. The goal is a credible baseline for the model.
Modern tests use synthetic controls rather than simple matched markets. Instead of pairing Tampa with Miami, a synthetic control builds a weighted blend of many untreated markets to mirror your treatment group's pre-period behavior. This usually gives meaningfully better precision than one-to-one matching, especially when your business has fewer than 50 strong markets to choose from.
The Stella benchmark of 225 tests found that pre-test fit quality was the single strongest predictor of whether a test reached statistical significance. That is the practical lesson. A holdout is not made valid by labeling it an experiment. It is made valid by careful design.
For ecommerce, that often means avoiding obvious outliers. A market with a large wholesale customer, a regional event, a retail launch, weather disruption, or a fulfillment issue is usually a bad control. You want markets that represent normal business behavior.
How do Google Marketing Areas reduce contamination?
Google's native geo-based Conversion Lift uses Google Marketing Areas, or GMAs, as experimental units.
Google describes GMAs as sub-country regions designed for geo experiments, drawn so their boundaries cut through the least populous areas and avoid common commutes. The system also uses a contamination model to estimate cross-area travel, since a person can see an ad in one area and convert in another.
This matters because contamination weakens any geo experiment. Contamination shows up when the control group is not truly unexposed: users travel between regions, location signals are imperfect, ads trigger on interest in a location, or conversions get recorded in a different geography than the exposure.
When contamination is high, the gap between treatment and control shrinks. The campaign can look less incremental than it really is. Native Google Conversion Lift manages some of this through GMAs. In manual studies, you have to manage it through targeting choices, exclusions, data mapping, and post-launch checks.
How do you set up location targeting for a holdout?
For a manual holdout, the campaign setup has to match the experiment design.
The basics:
- Identify treatment and control regions
- Keep campaigns active in treatment regions
- Exclude or pause campaigns in control regions
- Hold budgets, creative, bidding, and landing pages stable
- Monitor delivery to make sure ads are not leaking into control regions
The single setting most people get wrong is "Presence" versus "Presence or Interest." Google Ads location targeting defaults to "Presence or Interest," which means your ads can reach users who are physically in a location, regularly in a location, or who have shown interest in that location. For a holdout, that last bucket is contamination waiting to happen.
If you are isolating Tampa, Atlanta, or Dallas as control regions on default settings, your "control" can be receiving impressions from users hundreds of miles away who searched for something Tampa-related. Switch to "Presence" only for the campaigns inside the test. This is a 30-second change that many tests skip.
After the test launches, check the matched locations report. It shows performance based on the locations that actually matched your ads. If meaningful traffic appeared in places that should be excluded, the test is compromised. Catching this on day 3 is recoverable. Catching it on day 21 is not.
What data do you need?
A useful incrementality study needs clean data by date and geography. At minimum:
- Ad spend by date and geography
- Impressions, clicks, conversions, revenue, orders by date and geography
- Treatment and control region labels
- Test start and end dates
- Notes on promotions, outages, stockouts, and major changes
The geography key is critical. If Google Ads spend reports by city, Shopify revenue by ZIP, and finance by state, the data will not join cleanly without mapping logic. Bad mapping distorts the result.
A few questions to settle before the test starts:
- Are you using shipping address, billing address, store location, or user location?
- Are refunds included or excluded?
- Are subscriptions counted on first purchase only, or on recurring revenue?
- Are Amazon, wholesale, retail, or offline sales included?
- How are delayed conversions handled?
- Is there a post-treatment window?
Incrementality is not just a media buying exercise. It is a data design exercise.
How long should the test run?
There is no universal length. A common starting point is three to four weeks, but that is not a rule.
Google's geo-based Conversion Lift documentation uses a feasibility status (High, Medium, or Low) to flag the likelihood of generating precise results. High feasibility gives the best chance of statistical significance. Google does not recommend running a study with low feasibility without adjusting design or budget.
Rough guidelines that work in practice:
- High-volume DTC ($30M+ revenue, short purchase cycle): 2-4 weeks usually works
- Mid-market DTC ($5M-$30M): 4-6 weeks for most channels, longer for upper-funnel
- Lower-volume or considered-purchase categories: 6-8 weeks plus a 2-week post-treatment window
- YouTube, Demand Gen, upper-funnel: add at least 2 weeks of post-treatment to capture lagged conversions
Pick duration based on whether the study has enough power to answer the question, not because three weeks sounds normal.
When NOT to run an incrementality test
Most posts on this topic push you toward testing every campaign. That is wrong. A test costs money in opportunity cost and team time. Skip the test if any of these are true:
- You don't have enough volume. If your treatment markets won't generate at least a few hundred conversions during the test window, you probably can't detect a realistic effect.
- The decision is already made. If leadership has decided to keep branded search live no matter what, don't burn $30K on a test to confirm it.
- You're in peak season. Black Friday, your category's seasonal peak, or a major launch are bad windows. You want normal business behavior, not noise.
- You're already running other major changes. New site launch, new pricing, new creative across the board, or a shipping promotion will all confound the result.
- The cost of being wrong is small. If we're talking about a $5K/month campaign, a careful read of platform data plus an MMM is often enough.
The best test is the one that changes a meaningful budget decision. The worst test is one run because it sounded responsible.
How do you calculate lift, incremental revenue, and iROAS?
The three metrics that matter:
Lift is the difference in outcomes between the exposed group and the estimated counterfactual. Lift = treatment outcome minus estimated control outcome
Incremental revenue is the revenue caused by the campaign. Incremental revenue = treatment revenue minus counterfactual revenue
iROAS is incremental return on ad spend. iROAS = incremental revenue / ad spend
Google's Conversion Lift reporting includes incremental ROAS, incremental conversions, incremental conversion value, and incremental cost for geography-based studies, plus a confidence interval around the point estimate.
The difference between ROAS and iROAS is the whole point. ROAS reflects attributed revenue. iROAS reflects incremental revenue.
If a campaign spends $10,000 and Google reports $50,000 in attributed revenue, platform ROAS is 5x. If a study estimates that only $20,000 of that was caused by the campaign, iROAS is 2x. A different budget conversation entirely.
For context, the median iROAS across 225 geo tests on Stella's platform was 2.31x, with 50% of tests falling between 1.36x and 3.24x. If your test comes back at 1.5x, that is not a failure. That is roughly the 25th percentile of working DTC programs. The decision is whether your contribution margin can support that iROAS, not whether it matches a vendor's pitch deck.
How should you read the results?
Interpret based on study design, confidence level, and business economics.
A strong result usually means the campaign drove measurable incremental conversions or revenue. If iROAS is above your required threshold, the campaign deserves more budget. A weak result means the campaign may be receiving credit without creating enough incremental value. An inconclusive result does not mean the campaign worked or failed. It means the study did not produce enough evidence for a confident call.
Marketers want clean answers from every test. A well-run study can still come back inconclusive if volume is too low, the effect size is too small, or market behavior is too noisy. Google's documentation recommends waiting until the study ends rather than reacting to mid-test reads.
The confidence interval matters more than the point estimate. If iROAS comes in at 2.2x with a confidence interval of 0.4x to 4.0x, the test technically detected lift, but the range is too wide to act on. A point estimate of 2.2x with a confidence interval of 1.8x to 2.6x is a result you can take to your CFO.
Also: do not interpret iROAS without margins. A 2x iROAS is excellent for one business and unprofitable for another. Contribution margin, customer acquisition cost, repeat purchase rate, payback period, and inventory all matter.
The study gives you the causal estimate. The business model tells you what to do with it.
What kills a Google Ads incrementality study?
A few patterns kill more tests than anything else.
Poor geo matching. If treatment and control regions behaved differently before the study, they will not produce a credible comparison during it. A control group should not be chosen because it is convenient.
Contaminated control regions. Ads leak into control regions through location targeting settings, travel, broad match, interest signals, or messy conversion geography. Spot check the matched locations report on day 3 and day 7, not day 21.
Too many campaign changes during the test. Changing budgets, bids, creative, landing pages, audience targeting, or promotions mid-test makes the result almost impossible to interpret. A study should isolate the effect being tested.
Low statistical power. Too little spend, too few conversions, or too much volatility means the test cannot detect lift. Google's feasibility framework exists for this exact reason.
Bad data joins. If spend, revenue, and geography do not align correctly, the model produces a confident but wrong answer. This is most common when teams combine Google Ads, Shopify, CRM, and offline revenue without aligning geography definitions.
Outlier events in control markets. A Shopify outage, a regional weather event, a viral TikTok in one DMA, a competitor's flash sale. Document anything weird that happens during the test. If a control market loses two days of revenue to an outage, you may need to exclude it from the analysis.
Over-reading platform ROAS. Platform ROAS is not proof of incrementality. It is one input.
How does incrementality connect to MMM?
Incrementality and marketing mix modeling solve different parts of the same problem.
Incrementality measures the causal impact of a specific campaign, channel, or budget change. MMM estimates how channels contribute to business outcomes over time. They are strongest together.
A geo holdout calibrates MMM by giving the model real causal evidence. MMM allocates budget across channels, time, and saturation curves.
Google's Meridian is an open-source MMM framework, and Google previewed Meridian GeoX in May 2026, a geo experimentation layer designed to feed experiment results into MMM as priors. The direction is clear: not attribution alone, not one-off tests alone. A connected system where experiments validate models, and models guide budget. Stella's MMM and Always-On Incrementality are built around the same idea. Stella's MMM achieves 87% accuracy in forward tests on average, and 95% when calibrated with iROAS from the Experiments tool. For a deeper walkthrough on Meridian specifically, see Getting Started with MMM Using Google Meridian.
Privacy: why incrementality has gone mainstream
Apple's App Tracking Transparency limited mobile signal. Google's Privacy Sandbox reshaped how third-party data flows. Multi-touch attribution lost coverage as cookies disappeared. By mid-2025, over half of brands and agencies reported using incrementality testing as a regular practice, up from a small minority five years earlier.
Geo-based measurement does not depend on user-level tracking. It uses aggregated regional data, which sidesteps most of the privacy problem. That is why Google built Meridian and GeoX around aggregated, privacy-safe inputs, and why incrementality testing has moved from "advanced technique" to baseline measurement.
What should you do after the test ends?
The study should lead to an action.
If iROAS is strong, scale spend, test a higher budget, or expand the campaign. If iROAS is weak, reduce spend, change creative, or reallocate. If the result is inconclusive, improve the design, increase sample size, choose different geographies, or use a more sensitive KPI.
The worst outcome is running the study, sharing the result, and changing nothing. That happens more often than it should. A real measurement process should answer:
- What did the campaign cause?
- Was it profitable?
- Should we spend more, less, or differently?
- What did we learn for the next test?
- How does this update our MMM or budget model?
How Stella helps
Manual incrementality studies are possible. They are also easy to get wrong. The hard parts are not the formulas. The hard parts are picking the right regions, building a clean counterfactual, checking pre-test fit, managing contamination, joining data correctly, and reading the result without overstating certainty.
Stella's Incrementality Tool runs geo holdouts, inverse holdouts, and scale tests with statistical validation, region-selection automation, and weighted synthetic controls. Always-On Incrementality moves past one-off tests and tracks incremental performance continuously across every connected platform. Stella's MMM connects experiment results to budget planning at a flat $3,000 per month, instead of the $15K-$80K consulting model.
One test is useful. A measurement system is better.
The Bottom Line
The best way to measure Google Ads incrementality is to run a controlled experiment that compares exposed and unexposed regions, then calculate the incremental conversions, revenue, and iROAS caused by the campaign.
If your account is eligible, Google's native Conversion Lift based on geography is a reasonable place to start. If you need cleaner business data, full backend revenue, or a measurement system that calibrates MMM, a manual or platform-supported geo holdout is the better fit.
Either way, the principle is the same. Do not rely on attributed revenue alone. Measure what changed because the ads ran.
Run your first geo holdout on your own data. Start a free 7-day trial of Stella and validate one campaign before your next budget review
%20(5).png)
.png)
%20(4).png)
.png)