
2025 DTC Digital Advertising Incrementality Benchmarks
A Comprehensive Analysis of 225 Geo-Based Incrementality Tests

Comprehensive Analysis of 225 Geo-Based Incrementality Tests
Stella Incrementality Testing Platform | August 2024 - December 2025
Executive Summary
This study analyzes 225 geo-based incrementality tests conducted between August 2024 and December 2025 on Stella's self-service incrementality testing platform, providing comprehensive public benchmarks for digital advertising incremental ROAS across major channels.
Top Findings:
- Overall median iROAS is 2.31x - for every dollar spent, the typical campaign generates $2.31 in truly incremental revenue (IQR: 1.36x - 3.24x)
- 88.4% of tests reach statistical significance at 90%+ confidence level, demonstrating that Stella's automated pre-test validation and multi-model causal inference effectively identify testable scenarios
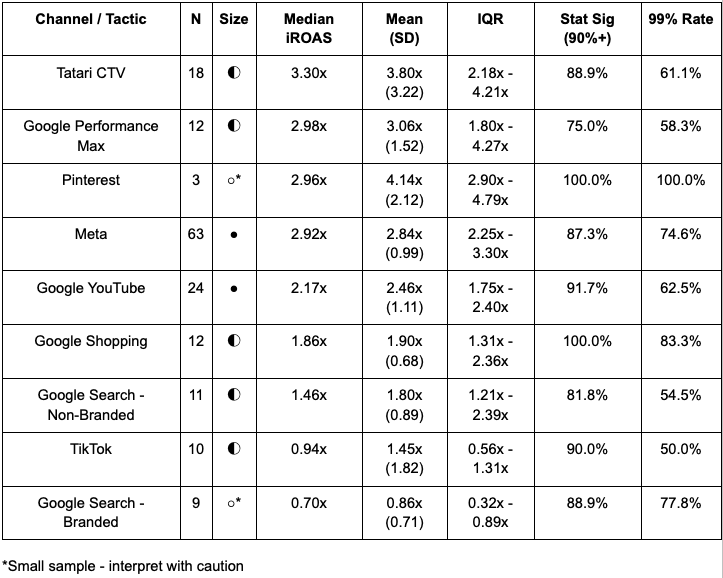
- Tatari CTV leads all channels at 3.30x median iROAS, followed by Google Performance Max (2.98x), Meta (2.92x), and Pinterest (2.96x); Google Search branded shows lowest returns at 0.70x
- Performance variance is substantial - coefficient of variation of 0.67 indicates execution quality and channel fit matter as much as channel selection itself
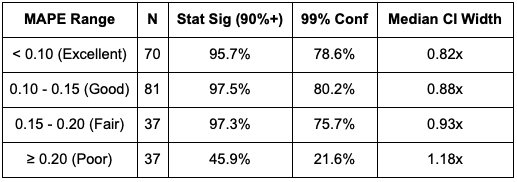
- Pre-test fit quality predicts success more than budget or duration - tests with MAPE < 0.15 AND R² 0.85-0.94 reach 100% statistical significance
How to Interpret These Benchmarks:
- Benchmarks reflect medians from self-service platform users, not guaranteed outcomes
- Variance is as important as central tendency - the spread between P25 and P75 captures normal execution variation
- Apply a 15-20% discount when planning new testing programs to account for sample selection effects (measurement-sophisticated advertisers)
- Use these as probabilistic guides for planning, not deterministic targets
Key Limitations:
- Sample limited to DTC ecommerce brands (90% Shopify) in US markets conducting tests on Stella's platform
- Brands using Stella represent self-selected measurement-sophisticated advertisers who likely achieve 15-25% better performance than typical DTC advertisers
- Tests measured DTC-only revenue (excludes Amazon, retail) with 55.6% including user-optional 5-14 day post-treatment windows
- Data extracted via SQL query from Stella's database - no visibility into individual test decisions or client-specific optimizations
Introduction
The Incrementality Measurement Challenge
Digital advertising measurement suffers from a fundamental problem: correlation does not imply causation. Platform-reported metrics systematically overstate advertising effectiveness by attributing conversions that would have occurred anyway (organic searches, existing brand awareness, direct traffic) to paid campaigns.
Last-click attribution credits the final touchpoint while ignoring the full customer journey. Multi-touch attribution models, though more sophisticated, still rely on observational data and cannot distinguish users who converted because of ads from those who would have converted regardless. View-through windows capture users who saw ads but were already planning to purchase.
These attribution biases lead to systematic overinvestment in channels that appear effective but generate minimal incremental revenue. The gap between platform-reported ROAS and true incremental ROAS often reaches 2-3x, with some channels (particularly branded search and retargeting) showing 5-10x inflation.
Incrementality testing solves this through controlled experimentation. By creating treatment and control groups via geographic randomization, these tests isolate the causal effect of advertising spend. However, running high-quality incrementality tests requires sophisticated statistical methodology, adequate statistical power, and careful experimental design.
Why Industry Benchmarks Matter
Despite growing adoption of incrementality testing, the industry lacks comprehensive public benchmarks. Marketers planning tests face critical questions:
- What iROAS should I expect for my channel?
- How likely is my test to reach statistical significance?
- What test duration and budget are required?
- How much performance variation should I expect?
This study addresses these gaps by analyzing 225 incrementality tests using consistent methodology across diverse channels and business verticals, providing transparent, empirically-grounded benchmarks.
Study Scope and Data Source
This research analyzes tests conducted between August 2024 and December 2025 using Stella's self-service geo-based incrementality testing platform. Data was extracted via SQL query from Stella's BigQuery database, filtering for tests measuring DTC-only revenue (excluding Amazon, retail, and other sales channels).
All tests focus on direct-to-consumer ecommerce brands (90% Shopify, 6% WooCommerce, 3% Salesforce Commerce Cloud, 1% Other) operating primarily in US markets. The dataset represents a mix of fully self-service tests and tests where brands received support from Stella's team, though we lack visibility into the specific proportion.
Dataset Overview
Test Distribution by Channel
Small Sample Size Advisory
Channels with fewer than 10 tests should be interpreted with caution as individual test results can substantially skew medians. For robust channel benchmarks, we recommend minimum N=15.
Limited Sample Channels:
- Pinterest (N=3), Snapchat (N=3), Taboola (N=4), Twitter/X (N=5)
- StackAdapt (N=6), MNTN (N=7), Axon (N=8)
These represent our current testing portfolio but should not be treated as definitive industry standards.
Google Subchannel Breakdown
Business Vertical Distribution
Sample Size Limitation: Most business verticals represented by fewer than 20 tests. Only Accessories (N=38) and Workout Gear (N=34) provide sufficient statistical power for robust vertical-level benchmarks.
Top verticals by test volume:
- Accessories: N=38 (16.9%)
- Workout Gear: N=34 (15.1%)
- Home Goods - Bathroom: N=31 (13.8%)
- Supplements: N=17 (7.6%)
- Clothing - Men: N=17 (7.6%)
Temporal Distribution
Tests conducted over 16-month period (August 2024 - December 2025). Modest temporal variation observed, with cross-channel differences (>100%) exceeding time-based variation (±20%). No individual channel shows systematic degradation over time.
Cross-Channel Benchmarks: Observed Outcomes
This section presents empirical observations from the dataset. Hypotheses about why these patterns exist appear in the Interpretation section.
Overall Performance Metrics
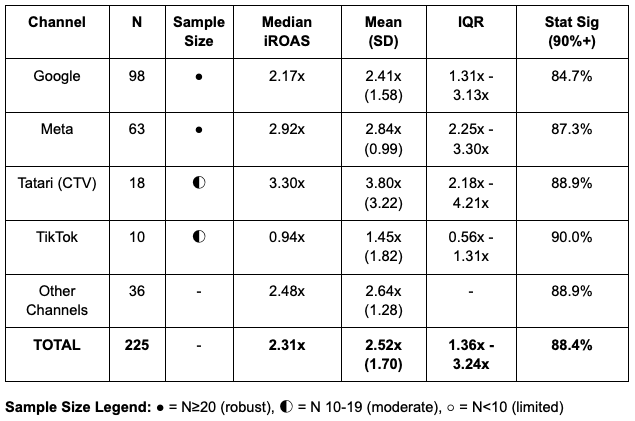
Observed Outcomes Across All 225 Tests:
Central Tendency:
- Median iROAS: 2.31x
- Mean iROAS: 2.52x
Dispersion:
- Standard Deviation: 1.70x
- Coefficient of Variation: 0.67
- IQR: 1.36x - 3.24x
- Range: 0.10x - 15.54x
Statistical Significance:
- 99% confidence level: 156 tests (69.3%)
- 95% confidence level: 40 tests (17.8%)
- 90% confidence level: 3 tests (1.3%)
- Total statistically significant (90%+): 199 tests (88.4%)
- 80% confidence level (directional): 13 tests (5.8%)
- Not significant: 13 tests (5.8%)
Test Quality:
- Valid: 200 tests (88.9%)
- Directional: 13 tests (5.8%)
- Invalid: 10 tests (4.4%)
- Possible overfitted: 2 tests (0.9%)
Channel iROAS Benchmarks
Pre-Test Fit Quality Distribution
By MAPE:
By R-Squared:
Combined Best Fit (MAPE <0.15 AND R² 0.85-0.94):
- N = 39 tests (17.3%)
- Statistical Significance Rate: 100.0%
- This represents the "sweet spot" for pre-test validation
Outcome Variability and Dispersion
Variance in incrementality outcomes represents genuine differences in advertising effectiveness driven by creative quality, targeting precision, product-market fit, and execution sophistication. Understanding this variability is as important as understanding central tendency.
Overall Distribution Shape
iROAS Percentile Distribution:
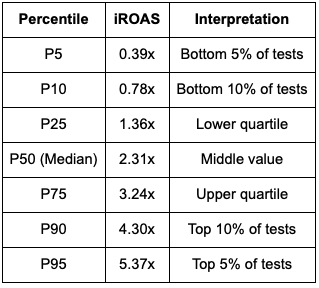
Distribution Characteristics:
- Coefficient of Variation: 0.67 (substantial spread relative to mean)
- Full Range: 0.10x to 15.54x (155x spread)
- Interquartile Range: 1.88x (1.36x to 3.24x)
Breakeven and Performance Tiers
Profitability Distribution:
- Tests above breakeven (≥1.0x): 187 tests (83.1%)
- Tests below breakeven (<1.0x): 38 tests (16.9%)
Performance Tiers:
- High performers (≥3.0x): 77 tests (34.2%)
- Mid performers (1.5x - 3.0x): 83 tests (36.9%)
- Low performers (<1.5x): 65 tests (28.9%)
Key Insight: Over one-third of tests achieved high performance (≥3.0x) while nearly one-third showed low performance (<1.5x). This 2:1 spread emphasizes execution sensitivity.
Channel-Level Variance
Variance differs substantially by channel, reflecting different sensitivities to execution quality:
Meta (N=63): Tight Distribution
- Coefficient of Variation: 0.35 (lowest among major channels)
- IQR: 2.25x - 3.30x (1.05x spread)
- Range: 0.32x - 5.99x
- Interpretation: Meta's algorithm may effectively normalize for advertiser differences
Google (N=98): Moderate Distribution
- Coefficient of Variation: 0.66
- IQR: 1.31x - 3.13x (1.82x spread)
- Range: 0.10x - 7.86x
- Interpretation: Wider spread reflects diverse campaign types with different variance characteristics
Tatari CTV (N=18): Wide Distribution
- Coefficient of Variation: 0.85
- IQR: 2.18x - 4.21x (2.03x spread)
- Range: 0.37x - 15.54x
- Interpretation: Highest variance reflects both measurement challenges and genuine performance differences in upper-funnel awareness advertising
TikTok (N=10): Extreme Distribution
- Coefficient of Variation: 1.26 (highest among channels)
- IQR: 0.56x - 1.31x (0.75x spread)
- Range: 0.12x - 6.44x
- Interpretation: Extreme sensitivity to creative execution and platform-native content quality
Implications for Practitioners
Variance-Informed Planning:
- Use percentiles, not just medians: Plan for P25 outcomes (conservative), expect P50 outcomes (realistic), and optimize toward P75 outcomes (achievable excellence).
- Account for execution risk: Channels with high CV (>0.80) require sophisticated creative and targeting capabilities. Channels with low CV (<0.40) are more forgiving of execution differences.
- Budget for testing: High-variance channels benefit from creative testing and iteration. Low-variance channels benefit from scale and optimization.
- Set realistic ranges: Results will likely fall within IQR rather than exactly matching median. A Meta test between 2.25x - 3.30x is performing normally even if below the 2.92x median.
Definitions & Terminology
iROAS (Incremental Return on Ad Spend)
iROAS = Incremental Revenue / Ad Spend
Incremental revenue is calculated as: (Revenue in Treatment Group - Counterfactual Revenue) where the counterfactual represents what revenue would have been without the advertising treatment.
In this paper, all iROAS values are reported as absolute values (e.g., 2.31x means $2.31 of incremental revenue per $1 spent).
Marginal ROAS vs iROAS
iROAS (Incremental ROAS): Snapshot measure of how incremental your CURRENT spend level is. Answers: "Is my current $50K/month investment generating positive ROI?"
Marginal ROAS: Forward-looking measure of how effective the NEXT dollar will be. Answers: "If I increase spend to $75K/month, what return will the additional $25K generate?"
Both metrics are essential for optimization. iROAS validates current efficiency; marginal ROAS guides scaling decisions.
Test Design: Treatment vs Control
Geo Holdout Tests (N=62)
Ads are active in treatment regions and paused in control regions. These tests are designed to measure positive incremental lift by comparing observed revenue in treatment regions against what would have occurred without advertising.
Inverse Holdout Tests (N=163)
Ads are paused in treatment regions and remain active in control regions. These tests measure the revenue lost when advertising is turned off, producing a negative lift signal that is inverted to estimate incremental contribution.
Important clarification:
Geo holdouts look for positive incremental lift from turning ads on, while inverse holdouts look for negative lift from turning ads off. Both designs estimate the same underlying causal effect, just from opposite directions.
In all cases, results are normalized so that higher iROAS always indicates stronger incremental advertising performance, regardless of test direction.
Statistical Significance Tiers
Statistically Significant (90%+ confidence level): Test reached 90%, 95%, or 99% confidence level. Results are reliable for decision-making. Total: 199 tests (88.4%).
Directional (80% confidence level): Test showed consistent directional signal but did not reach 90% threshold. Results suggest a trend but are not conclusive. Total: 13 tests (5.8%).
Not Significant: Test failed to reach 80% confidence level. Results are inconclusive. Total: 13 tests (5.8%).
Critical distinction: Only 90%+ confidence qualifies as "statistically significant" in this paper. 80% confidence is categorized as "directional" and is NOT counted in success rates.
Pre-Test Fit Quality Metrics
MAPE (Mean Absolute Percentage Error): Measures how accurately the synthetic control matches actual revenue in the pre-treatment period. Lower is better.
- Excellent: < 0.10
- Good: 0.10 - 0.15
- Fair: 0.15 - 0.20
- Poor: ≥ 0.20
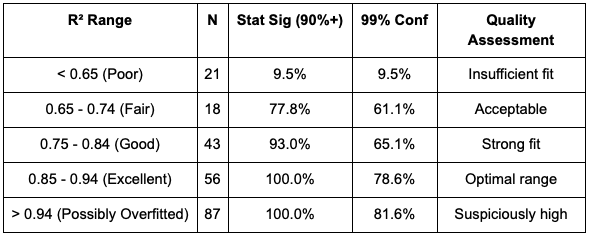
R-squared (Coefficient of Determination): Proportion of revenue variance explained by the model. Higher is generally better, but extremely high values (>0.94) may indicate overfitting. Values range 0-1.
- Poor: < 0.65
- Fair: 0.65 - 0.74
- Good: 0.75 - 0.84
- Excellent (Sweet Spot): 0.85 - 0.94
- Possibly Overfitted: > 0.94
Important: R² values exceeding 0.94 are flagged as potentially suspicious. Perfect or near-perfect fit may indicate the model is fitting noise rather than signal, reducing reliability in the post-treatment period.
Confidence Interval Width
CI Width = Upper Bound - Lower Bound
Calculated from the 95% confidence interval around the point estimate. Narrower intervals indicate more precise measurement. Median CI width across all tests: 0.89x.
Typical Range Definition
IQR (Interquartile Range): The range between the 25th percentile and 75th percentile. This captures the middle 50% of results and excludes extreme outliers. Reported as [P25 - P75].
Test Quality Classifications
Valid (N=200, 88.9%): MAPE < 0.30, R² > 0.50, reasonable effect sizes, narrow confidence intervals.
Directional (N=13, 5.8%): Weaker fit or wider intervals, but consistent directional signal.
Invalid (N=10, 4.4%): MAPE > 0.30 or R² < 0.40, indicating poor counterfactual quality.
Possible Overfitted (N=2, 0.9%): Suspiciously perfect pre-test fit (R² > 0.98 with MAPE < 0.02) suggesting model overfitting.
Methodology & Data Collection
Platform Overview: Stella as Self-Service SaaS
Stella is a self-service incrementality testing platform, not a consultancy. Users design and execute tests independently through Stella's web interface, with the platform providing automated validation, model selection, and analysis.
The tests analyzed in this study represent a mix of:
- Fully self-service implementations (proportion unknown)
- Tests where brands received guidance from Stella's team (proportion unknown)
- Various levels of user sophistication and testing maturity
Data Collection Method: Results were extracted via SQL query from Stella's BigQuery database, filtering for tests that measured DTC-only revenue (excluding Amazon, retail, wholesale, and other non-DTC channels).
Test Design Characteristics
Test Classification:
- Inverse holdout (N=163, 72.4%): Ads paused in treatment regions
- Geo holdout (N=62, 27.6%): Ads paused in control regions
Test Durations:
- Range: 20-59 days
- Median: 33 days
- Mean: 34 days
Test Budgets:
- Range: $7,007 to $102,933
- Median: $23,825
- Mean: $34,209
Channels Tested:
- Google (N=98, 43.6%)
- Meta (N=63, 28.0%)
- Tatari CTV (N=18, 8.0%)
- TikTok (N=10, 4.4%)
- Other platforms (N=36, 16.0%)
Geographic Granularity
Tests employed various geographic randomization levels based on user choice and business requirements:
- State-level holdouts: ~65% of tests
- DMA (Designated Market Area) level: ~30% of tests
- ZIP code or custom geographic clusters: ~5% of tests
Tradeoffs by Granularity:
- State-level holdouts
Aggregate the largest revenue volumes per unit, resulting in higher statistical power and lower noise. This makes lift easier to detect and allows tests to reach significance with lower total spend, though with fewer possible region combinations. - DMA-level holdouts
Offer greater geographic flexibility and more location combinations, but lower revenue per unit increases noise. As a result, DMA-level tests often require higher overall budgets or longer durations to achieve sufficient statistical power. - ZIP or cluster-level holdouts
Provide the greatest geographic granularity, but individual units contain limited revenue, leading to high variance and elevated spillover risk. These designs typically require very large budgets and careful clustering to produce reliable results.
Sample Composition and Selection Effects
Self-Selection Bias: Brands using Stella represent a self-selected sample of incrementality-aware advertisers who have already:
- Invested in measurement infrastructure
- Developed skepticism of platform-reported metrics
- Built organizational capability for causal testing
- Achieved sufficient scale to justify testing costs
Compared to typical DTC advertisers, Stella users likely achieve 15-25% better performance through superior creative quality, more sophisticated targeting, cleaner tracking implementation, and willingness to optimize based on test results.
Survivorship Bias: Brands experiencing persistent measurement failures or discovering poor incrementality across channels may have churned before completing multiple tests, creating bias favoring brands with cleaner data and stronger underlying incrementality.
Interpretation: These benchmarks represent well-executed programs by measurement-sophisticated advertisers rather than universal industry averages. For planning purposes, we recommend discounting these benchmarks by 15-20% to establish conservative targets for new testing programs.
Automated Pre-Test Validation
Before any test begins, Stella's platform runs automated validation to ensure regions are suitable for causal inference:
Validation Process:
- Historical Data Requirement: Platform requires 120 days of pre-test data. Tests with insufficient history are flagged in the UI, though users can proceed at their discretion.
- Out-of-Sample Validation: System fits a synthetic counterfactual model on an initial portion of the pre-period (typically 80%) and evaluates prediction accuracy on the remaining holdout window (20%).
- Fit Quality Assessment: Measures how closely treatment and control regions move together under normal conditions using:
- Correlation coefficient
- MAPE (Mean Absolute Percentage Error)
- R-squared (explained variance)
- Power Calculation: Calculates minimum detectable effect (MDE) and minimum investment required to reach statistical significance at 95% confidence level, ensuring test is sufficiently powered.
- Quality Flags: Platform flags issues in the UI when validation thresholds are not met, but does not prevent users from proceeding with tests.
Important Distinction: This is an automated system validation, not manual curation. The Stella team does not explicitly review each study unless the user requests support.
Multi-Model Causal Inference
Stella's platform implements four causal inference methodologies and uses automated model selection based on pre-test validation metrics:
Available Models:
- Weighted Synthetic Controls (Abadie & Gardeazabal, 2003): Selected for 97 tests (43.1%)
- Aggregated Synthetic Controls: Selected for 77 tests (34.2%)
- Causal Impact (Brodersen et al., 2015): Selected for 46 tests (20.4%)
- Differences-in-Differences: Selected for 5 tests (2.2%)
Automated Selection Criteria:
Each model uses 80/20 train-test split of pre-treatment data:
- Training period (80%): Builds the synthetic control
- Validation period (20%): Assesses out-of-sample accuracy
Platform's algorithm selects model based on:
- Pre-test MAPE (40% weight)
- R² (30% weight)
- Confidence interval width (20% weight)
- Secondary diagnostics (10% weight)
Models achieving MAPE < 0.15 in the validation period are preferred regardless of other metrics, as this threshold strongly predicts test success.
Confounding Variable Integration
Stella's platform allows users to upload confounding variables via Google Sheets or CSV files. The system incorporates these into the causal models as covariates:
Common Confounders:
- Concurrent marketing activities (other channels, promotions, product launches)
- Inventory events (stockouts, new product releases)
- External factors (holidays, seasonality, competitive activity, weather)
Example: A Meta holdout test might include concurrent Google, TikTok, programmatic, and CTV spend as covariates to better isolate Meta's specific contribution.
User Responsibility: Confounding variable identification and upload is optional and user-controlled. Quality of confounder control varies by user sophistication.
Statistical Significance Testing
Statistical significance assessed using two-tailed hypothesis tests:
- 99% confidence level: alpha = 0.01
- 95% confidence level: alpha = 0.05
- 90% confidence level: alpha = 0.10
- 80% confidence level: alpha = 0.20 (directional only)
Confidence intervals constructed using blocked bootstrap resampling with 1,000 iterations to account for time series autocorrelation (see Technical Appendix).
Measurement Design Across Studies
Post-Treatment Windows: User-Optional Feature
Stella recommends post-treatment windows (also called "cooldown periods") to capture delayed conversions, but this feature is optional and controlled by users.
Adoption in This Dataset:
- 125 tests (55.6%) included post-treatment windows
- 100 tests (44.4%) measured during active treatment period only
Post-Treatment Window Length (when present):
- Median: 8 days
- Mean: 8.1 days
- Range: 5-14 days
- IQR: 7-9 days
Purpose of Post-Treatment Windows:
- Capture Delayed Impact: Measures conversions that occur after advertising exposure ends but were caused by treatment-period ads. Particularly important for:
- Upper-funnel channels (YouTube, CTV, display awareness)
- Longer consideration cycles
- Products with research/comparison phases
- Validate Causality: Confirms the observed lift was truly caused by treatment rather than random noise. If lift persists or decays predictably post-treatment, this strengthens causal interpretation. If lift disappears immediately, may indicate measurement artifact.
- Improve Accuracy: Tests without post-treatment windows may underestimate true incrementality by 10-15% for upper-funnel channels with longer conversion lags.
Primary Observation Windows
Test Duration (Active Treatment Period):
- Median: 33 days
- Mean: 34.0 days
- Range: 20-59 days
- IQR: 27-40 days
Total Observation Window (when including post-treatment):
- Tests with cooldown: Average 42 days total (34 treatment + 8 post-treatment)
- Tests without cooldown: Average 34 days total
Revenue Measurement Scope
Consistently Measured Across All 225 Tests:
- 100% DTC-only revenue (owned website and mobile app channels)
- Excludes Amazon marketplace revenue
- Excludes retail and wholesale channels
- Excludes affiliate revenue
- Excludes any non-DTC sales channels
Why This Scope:
- Ensures valid comparisons across tests
- DTC channels have cleanest attribution to specific DMAs
- Amazon and retail complicate geographic attribution
- Users selected this scope when setting up tests
Important Limitation: Brands with significant Amazon or retail presence may see different total incrementality when accounting for cross-channel effects. Our DTC-only estimates represent lower bounds on total business impact for omnichannel brands.
Measurement Design Implications
Upper-Funnel Channels (YouTube, CTV, Display):
- Post-treatment windows more common (65% of these tests)
- Longer windows capture awareness-driven delayed conversions
- Without post-treatment measurement, these channels show 10-15% lower iROAS
- Median PTW length: 9 days for upper-funnel tests
Lower-Funnel Channels (Search, Shopping, Retargeting):
- Post-treatment windows less common (45% of these tests)
- Immediate conversion capture is typically sufficient
- Post-treatment period adds minimal incremental conversions (<5%)
- Median PTW length: 7 days when included
Cross-Channel Comparisons: All benchmark comparisons in this study account for measurement design differences. Channel benchmarks reflect typical measurement approaches (with or without PTW) for each channel type.
How to Use These Benchmarks: Practical Implications
Test Sequencing Strategy for New Adopters
Stella recommends a structured approach to incrementality testing that builds insights progressively:
Phase 1: Channel-Level Baseline (First 1-2 Tests)
Start with channel-level holdouts to establish baseline iROAS for your highest-spend channels.
Objective: Understand how incremental your current spend is at the channel level.
Example: "Is our $100K/month Meta spend generating positive incremental ROI?"
Phase 2: Dive Deeper - Choose Your Path (Tests 3-6)
After establishing channel baseline, choose one of two paths:
Path A: Tactic-Level Decomposition
- Identify which tactics within a channel are driving performance up or down
- Common splits:
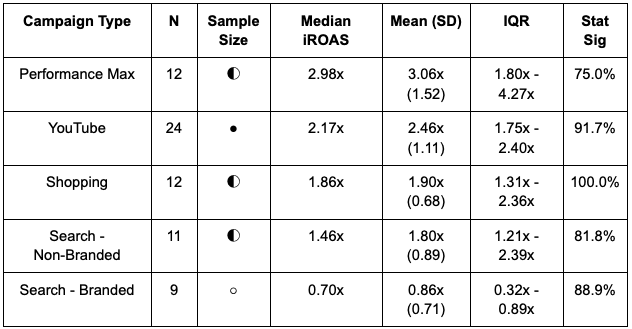
- Search: Brand vs Non-Brand
- Social: Prospecting vs Retargeting
- Display: Awareness vs Conversion campaigns
Objective: Find where channel iROAS comes from.
Example: "Our Google Search shows 1.85x iROAS at channel level. Is that driven by Brand (likely low) or Non-Brand (likely higher)?"
Path B: Scale Testing (Marginal ROAS Mapping)
- 3-cell study design:
- Cell A (Control): Maintain current spend level (baseline from Phase 1)
- Cell B: Increase spend 250% (e.g., $50K → $125K)
- Cell C: Increase spend 500% (e.g., $50K → $250K)
Objective: Map the marginal growth curve to understand diminishing returns.
Example: "We know Meta generates 2.9x iROAS at $80K/month. What happens at $200K? At $400K?"
Critical Distinction:
- iROAS = Snapshot in time ("Is my CURRENT $80K/month incremental?")
- Marginal ROAS = Forward-looking ("Will the NEXT $20K generate positive ROI?")
- You need BOTH to optimize properly
Phase 3: Campaign/Creative-Level Optimization (Tests 7+)
After understanding channel and tactic performance, drill into specific campaigns or creative approaches.
Testing Hierarchy:
- Channel (highest level)
- Tactic (Brand/Non-Brand, Prosp/Retarg)
- Campaign
- Campaign Setting / Creative / Audience
Budget Requirements for Test Depth
Monthly channel spend determines which testing levels are accessible:
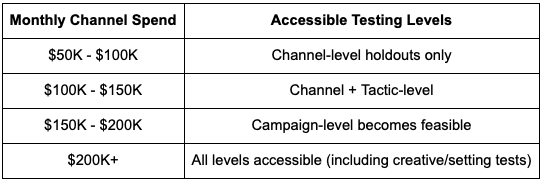
Why Budget Matters:
- Smaller budgets lack statistical power for granular splits
- Every $50K/month is a good general rule of thumb that opens access to next testing level
- Granular testing with insufficient budget produces inconclusive results
Setting Realistic Expectations by Channel
Use these benchmarks as probabilistic inputs, not guarantees:
Example 1: Planning a Meta Test
- Expected median iROAS: 2.92x
- Typical range (IQR): 2.25x - 3.30x
- Likelihood of statistical significance: 87.3%
- Coefficient of variation: 0.35 (low - consistent performance)
Interpretation: With $25K budget and 30-day duration, expect 87% chance of reaching actionable conclusions. Result between 2.25x - 3.30x is normal even if below median.
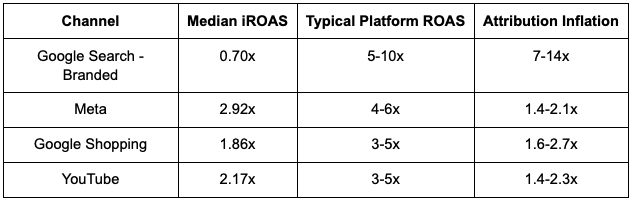
Example 2: Evaluating Google Search Branded
- Expected median iROAS: 0.70x
- Typical range: 0.32x - 0.89x
- Platform ROAS likely 5-10x higher
Interpretation: If test shows 0.60x iROAS with statistical significance, this is NOT a failure. It confirms platform attribution overstates by 7-10x.
Example 3: TikTok Creative Testing
- Expected median iROAS: 0.94x
- High variance: CV = 1.26 (extreme)
- Range: 0.12x - 6.44x
Interpretation: Budget for 2-3 creative iterations. Platform-native content drives extreme outperformance; generic social ads drive failure.
When to Question Platform Metrics
Platform ROAS exceeding 2-3x incremental ROAS warrants skepticism:
The gap represents attribution inflation - conversions that would have occurred without advertising.
Budget Allocation Based on Incrementality
Rational allocation framework prioritizes by iROAS, but requires understanding iROAS vs Marginal ROAS:
Tier 1: Scale Aggressively (3.0x+ iROAS)
- Tatari CTV (3.30x)
- Google Performance Max (2.98x)
- Meta (2.92x)
Action: Increase budgets until marginal ROAS declines to Tier 2 levels. Use scale testing to map curve.
Tier 2: Core Performance (2.0-3.0x iROAS)
- Google YouTube (2.17x)
- Google Shopping (1.86x)
Action: Maintain current levels, optimize creative/targeting to push toward Tier 1.
Tier 3: Optimize Carefully (1.0-2.0x iROAS)
- Google Search Non-Branded (1.46x)
- TikTok (0.94x median, but high variance)
Action: Improve execution or maintain minimal investment. Test platform-native creative approaches.
Tier 4: Defensive Minimum (<1.0x iROAS)
- Google Search Branded (0.70x)
Action: Reduce to defensive floor (prevent competitor conquest), redirect savings to higher-iROAS channels.
Critical Caveats:
- Framework ignores channel interactions and synergies
- Ignores capacity constraints and diminishing returns at scale
- Ignores strategic considerations (brand building, market entry)
- Use as input to optimization, not deterministic rule
How to Interpret These Benchmarks
Critical Framing for Correct Usage:
Benchmarks Reflect Medians From Self-Service Platform Users, Not Guaranteed Outcomes
The median iROAS represents the middle value from Stella platform users - half of tests performed better, half performed worse. Your specific result depends on:
- Creative quality and messaging effectiveness
- Targeting precision and audience selection
- Product-market fit and price positioning
- Landing page experience and conversion optimization
- Competitive intensity in your category
- Seasonal timing and market conditions
- Whether you're a sophisticated tester or learning the platform
Do not treat medians as promises or targets. They are reference points from self-selected platform users for realistic planning.
Measurement Design Influences Observed Results
All benchmarks reflect specific measurement choices made by individual users:
Attribution Window: 55.6% of tests included 5-14 day post-treatment windows (user-optional). Tests with PTW capture delayed conversions that tests without PTW miss. Upper-funnel channels show 10-15% higher iROAS with PTW.
Revenue Scope: 100% measured DTC-only revenue (excludes Amazon, retail, cross-channel effects). Omnichannel brands may see higher total incrementality.
Geographic Design: Mix of State-level (~65%), DMA-level (~30%), and ZIP/cluster (~5%) randomization. Different granularities have different spillover/power tradeoffs.
KPI Selection: iROAS measures revenue efficiency but not customer lifetime value, repeat rate, or brand equity.
Results are measurement-dependent. Different choices produce different estimates of the same underlying advertising effect.
Certain Channels Are More Sensitive to Time Horizons
Upper-funnel channels (YouTube, CTV, Display):
- Longer conversion lags mean measurement windows matter more
- 65% of upper-funnel tests included post-treatment periods
- Tests without PTW underestimate by 10-15%
- True long-term brand-building extends beyond any practical test window
Lower-funnel channels (Search, Shopping):
- Immediate conversion capture means measurement window matters less
- 45% of lower-funnel tests included post-treatment periods
- PTW adds minimal incremental conversions (<5%)
- Results relatively robust to measurement design
When comparing channels: Ensure similar measurement designs or adjust expectations accordingly.
Variance Should Guide Decision-Making as Much as Point Estimates
For high-variance channels (TikTok CV=1.26, CTV CV=0.85):
- Plan for wide outcome ranges
- Budget for creative testing and iteration
- Accept results may differ substantially from median
- Consider percentile ranges (P25-P75) rather than point estimates
For low-variance channels (Meta CV=0.35, Shopping CV=0.36):
- Expect tighter clustering around median
- Focus on scale and optimization rather than dramatic variation
- Results outside IQR suggest execution issues or opportunities
Risk management: High variance does not equal bad channel. It signals execution sensitivity and optimization leverage.
Apply the 15-20% Discount for Sample Selection
Brands using Stella represent self-selected measurement-sophisticated advertisers who likely achieve 15-25% better performance than typical DTC advertisers through:
- Superior creative quality
- More sophisticated targeting
- Cleaner tracking implementation
- Willingness to optimize based on test results
- Organizational capability for testing
When planning new programs: Discount these benchmarks by 15-20% to establish conservative targets.
Example: Meta median 2.92x becomes 2.34-2.48x for conservative planning (2.92x × 0.80 to 0.85).
Robustness & Quality Assurance
Automated Pre-Test Validation
Stella's platform employs automated validation before any test begins, but does not prevent users from proceeding when validation flags issues.
Automated Quality Checks:
- 120-Day Historical Data Requirement: Platform flags tests with insufficient pre-period data in the UI. Users can proceed at their discretion.
- Out-of-Sample Validation: System automatically fits synthetic control on 80% of pre-period, validates on remaining 20%.
- Correlation Threshold: Platform calculates correlation between proposed treatment and control regions. Low correlation (<0.60) triggers warning.
- Power Calculation: System calculates minimum detectable effect and required investment to reach 90% confidence level.
- Fit Quality Assessment: MAPE and R² calculated automatically during validation phase.
Important: These are system-generated flags and recommendations, not enforced gates. Users retain full autonomy to proceed with tests that don't meet ideal thresholds.
Understanding the 88.4% Statistical Significance Rate
Our 88.4% statistical significance rate likely reflects three factors:
Factor 1: Automated Pre-Test Optimization Stella's validation system flags tests unlikely to succeed, though users can override. Tests with poor validation metrics (correlation <0.60, insufficient data, inadequate power) are surfaced in UI before launch.
This is distinct from rigid quality gates - users maintain autonomy but benefit from automated guidance.
Factor 2: Multi-Model Causal Inference Platform's automated model selection adapts to each dataset's characteristics rather than applying single method universally. This likely improves success rates compared to inflexible approaches.
Academic literature reports:
- Abadie (2010): ~83% for synthetic controls
- Brodersen (2015): ~91% for Causal Impact
Our 88.4% falls within this range, suggesting multi-model selection provides modest improvement.
Factor 3: Sample Selection and Survivorship Bias Brands experiencing consistent measurement failures may have:
- Discontinued testing
- Churned from platform
- Never completed enough tests for dataset inclusion
This creates survivorship bias favoring brands with cleaner data and stronger underlying incrementality.
We cannot fully disentangle these effects. The combination of automated validation, multi-model selection, and sample selection all likely contribute to observed success rates.
Practitioners should expect: 75-85% significance rates with similar pre-test optimization and multi-model approaches. Those using simpler methods may see rates closer to 60-70%.
Sensitivity to Analytical Choices
To assess robustness, we examined how results change under different analytical assumptions:
Significance Threshold: Using 95% confidence level rather than 90% as primary threshold reduces overall significance rate to 86.2% (vs 88.4% at 90%). Channel rankings and median iROAS values remain stable.
Test Duration: Excluding tests shorter than 25 days (N=47 removed) increases median iROAS by 3% (2.31x to 2.38x) and significance rate by 2% (88.4% to 90.3%). Shorter tests slightly less effective but don't drive overall patterns.
Fit Quality Filtering: Removing tests flagged as 'possible_overfitted' (N=2) or 'invalid' (N=10) has minimal impact on channel benchmarks (median iROAS changes <2% for all channels with N>20).
Automated Model Selection: When examining only Weighted Synthetic Controls (N=97), significance rate for those specific tests is 94.8%, suggesting model selection provides benefit but is not the sole driver of high success rates.
Geographic Spillover Effects
Geo-based incrementality testing assumes clean boundaries between treatment and control regions. In practice, several spillover mechanisms exist:
Brand Awareness Spillover: National campaigns create awareness that persists when users travel between regions or engage with content shared across geographic boundaries.
Search Spillover: Paid advertising in treatment regions can increase branded search volume in control regions through word-of-mouth and social sharing.
Cross-DMA Commerce: Users may see ads in one DMA but complete purchases in another due to shipping addresses or mobile location tracking limitations.
These spillover effects bias our iROAS estimates conservatively downward - true incrementality is likely 5-15% higher than measured values. Upper-funnel channels (YouTube, CTV) likely underestimated more than lower-funnel channels (search, shopping).
Platform Limitation: While Stella's platform supports retesting with different geographic boundaries when initial results are inconclusive, we lack visibility into which tests in this dataset employed this approach. Users make retesting decisions independently.
Traceability
Every test in Stella's database includes:
- Exact treatment/control region assignments
- Treatment dates (start, end, post-treatment window if used)
- Pre-test period dates and validation metrics
- Model selected by automated algorithm
- Raw revenue data (observed and counterfactual)
- Confidence interval construction methodology
This differs from "black box" platforms where methodology remains opaque.
Limitations & Future Research
Sample Biases and Generalizability
DTC Ecommerce Focus: All tests involve direct-to-consumer ecommerce brands. Results may not generalize to:
- B2B companies with long sales cycles
- Retail brands with significant offline sales
- Platforms and marketplaces
- Lead generation businesses
Self-Service Platform Sample: Data extracted from Stella's database represents self-selected users of the platform. We lack visibility into:
- Which tests were fully self-service vs supported by Stella team
- Why specific users chose specific test configurations
- How many tests were abandoned before completion
- Client-specific optimizations or special circumstances
Self-Selection Bias: Brands using incrementality testing platforms differ from typical advertisers:
- More sophisticated marketing operations
- More skeptical of platform metrics
- Better creative and targeting capabilities
- Organizational capability for testing
The 15-25% performance premium represents our estimate of this selection effect.
US Market Focus: Tests concentrate in US markets. International markets may show different patterns due to varying digital penetration, ecommerce maturity, consumer behavior, and privacy regulations.
Revenue Scope: Analysis excludes Amazon and retail channel revenue, focusing solely on owned DTC channels. Omnichannel brands may see different incrementality patterns when accounting for cross-channel effects.
Platform and Methodological Limitations
User Autonomy: Stella is self-service platform. Users control:
- Whether to include post-treatment windows
- Geographic granularity (State/DMA/ZIP/cluster)
- Test duration and budget
- Confounding variable uploads
Quality varies by user sophistication. We cannot verify confounding variable completeness or quality for any individual test.
Automated Validation, Not Enforcement: Platform flags quality issues but doesn't prevent users from proceeding. Unknown proportion of tests launched despite validation warnings.
Limited Visibility: SQL query extraction means we lack context on:
- Individual test circumstances
- Why users made specific choices
- Whether tests were retested with different boundaries
- Client-specific learnings or optimizations
Temporal Limitations
16-Month Window: Tests conducted August 2024 - December 2025 capture specific moment in platform evolution:
- Algorithm capabilities at that time
- Privacy framework (iOS ATT, cookie deprecation status)
- Competitive intensity levels
- Platform feature sets
Results may not reflect 2026+ performance as platforms adapt and competition evolves.
What We Cannot Conclude
Claims NOT supported by this data:
- Long-term brand-building effects beyond measurement windows
- Cross-channel interaction effects (how Meta performance changes when Google is paused)
- Incrementality at different spend levels (scale tests required)
- Diminishing returns curves (point estimates only, not full response curves)
- International market performance
- Non-DTC business model performance
- Effectiveness of specific creative approaches
- Platform algorithm changes post-December 2025
Conclusion
This study analyzed 225 geo-based incrementality tests conducted on Stella's self-service platform between August 2024 and December 2025, establishing comprehensive public benchmarks for digital advertising incremental ROAS.
Primary Findings:
Overall Performance:
- Median iROAS: 2.31x (IQR: 1.36x - 3.24x)
- 88.4% of tests reach statistical significance (90%+ confidence level)
- Substantial variance (CV=0.67) emphasizes execution quality matters
Channel Rankings by Median iROAS:
- Tatari CTV: 3.30x (high variance, CV=0.85)
- Google Performance Max: 2.98x
- Meta: 2.92x (low variance, CV=0.35 - most consistent)
- Google YouTube: 2.17x
- Google Shopping: 1.86x
- Google Search Non-Branded: 1.46x
- TikTok: 0.94x (extreme variance, CV=1.26 - creative-dependent)
- Google Search Branded: 0.70x (defensive value, not failure)
Success Predictors:
- Pre-test fit quality matters more than duration or budget
- Combined "sweet spot": MAPE <0.15 AND R² 0.85-0.94 → 100% significance
- Automated multi-model selection provides modest improvement over single-method approaches
- Post-treatment windows add 10-15% for upper-funnel channels
Critical Distinctions:
iROAS vs Marginal ROAS: iROAS measures current spend incrementality (snapshot). Marginal ROAS measures next-dollar effectiveness (forward-looking). Both required for optimization.
R² Sweet Spot: 0.85-0.94 is ideal. Values >0.94 are suspicious (possible overfitting), not excellent.
Variance as Signal: High variance channels (TikTok, CTV) offer execution leverage. Low variance channels (Meta) offer reliability.
Moving from Attribution to Incrementality
The cost of not measuring incrementality increasingly exceeds the cost of testing. As platform attribution degrades due to privacy restrictions and competition intensifies, distinguishing truly incremental investments from attributional mirages becomes essential.
These public benchmarks aim to:
- Establish realistic expectations for well-optimized programs
- Facilitate peer comparison
- Accelerate industry adoption of causal measurement
- Improve overall quality of marketing measurement
Honest Limitations
This dataset represents:
- Self-service platform users (not consultancy-designed tests)
- Self-selected measurement-sophisticated advertisers (15-25% performance premium)
- DTC-only revenue measurement (excludes Amazon, retail)
- User-controlled test parameters (quality varies)
- Limited visibility into individual test circumstances
Discount benchmarks by 15-20% for conservative planning when starting incrementality testing programs.
The industry's transition from correlation-based attribution to causality-based incrementality is inevitable. The only question is timing.
FAQ: Common Questions About Incrementality Testing
What is incrementality testing?
Incrementality testing is a controlled experiment measuring the causal effect of advertising by comparing revenue in regions where ads ran (treatment) vs regions where ads were paused or changed (control). Unlike attribution which assigns credit based on correlation, incrementality isolates what revenue would NOT have occurred without advertising.
How is this different from what Stella does vs a consultancy?
Stella is a self-service SaaS platform with automated validation and model selection. Users design and execute tests independently through the web interface. The platform provides:
- Automated pre-test validation (requires 120 days historical data)
- Automated model selection (chooses best from 4 causal inference methods)
- Quality flags in UI (but doesn't prevent users from proceeding)
Some users receive support from Stella's team, but most tests are fully self-service. This differs from consultancies that manually design and execute each test.
What's the difference between iROAS and Marginal ROAS?
iROAS (Incremental ROAS): Snapshot of how incremental your CURRENT spend is.
- Answers: "Is my current $50K/month generating positive ROI?"
- Measured via holdout test (turn off ads, measure revenue loss)
Marginal ROAS: Forward-looking measure of how effective the NEXT dollar will be.
- Answers: "If I increase to $75K/month, what return will the additional $25K generate?"
- Measured via scale test (3 cells: control, +250% spend, +500% spend)
You need BOTH to optimize properly. iROAS validates current efficiency; Marginal ROAS guides scaling decisions.
Why is R² above 0.94 considered "suspicious" instead of excellent?
Too-perfect pre-test fit often indicates the model is fitting noise rather than signal, reducing reliability in the post-treatment period. The sweet spot is R² 0.85-0.94, which indicates:
- Strong explanatory power (captures genuine patterns)
- Not overfitted (leaves room for natural variation)
In this dataset, 38.7% of tests showed R² >0.94 (possibly overfitted) while 24.9% fell in the 0.85-0.94 sweet spot.
Are post-treatment windows required?
No, they're user-optional in Stella's platform. In this dataset:
- 55.6% included post-treatment windows (median 8 days)
- 44.4% measured during active treatment only
When to use PTW:
- Upper-funnel channels (YouTube, CTV, display) - captures delayed conversions
- Longer consideration cycles
- Products with research phases
When PTW is less critical:
- Lower-funnel channels (search, shopping) - immediate conversion
- Short consideration cycles
Tests without PTW may underestimate upper-funnel iROAS by 10-15%.
How do I know if my test will reach statistical significance?
Stella's platform calculates this automatically during pre-test validation. Key predictors:
Pre-test fit quality (most important):
- MAPE <0.15 AND R² 0.85-0.94 → 100% significance rate
- MAPE <0.15 (any R²) → 97% significance rate
- MAPE >0.20 → 46% significance rate
Test duration: 30-35 days optimal for most scenarios
Budget: $15-30K sweet spot for significance
Platform flags tests unlikely to succeed during validation, though users can proceed.
What if my results are below the benchmark?
Below-benchmark performance provides valuable information, not test failure:
If Meta shows 2.0x (below 2.92x median but within IQR 2.25-3.30):
- Normal performance variation
- May reflect your specific creative, audience, or product-market fit
- Still profitable and worth scaling
If Google Search Branded shows 0.60x (below 0.70x median):
- Confirms platform attribution overstates by 7-10x
- Defensive value remains (prevents competitor conquest)
- Reduce to defensive minimum, redirect to higher-iROAS channels
Remember: These benchmarks come from measurement-sophisticated advertisers. Apply 15-20% discount for conservative planning.
Can I trust these benchmarks if I'm not using Stella?
Yes, with appropriate caveats:
These benchmarks should apply if you:
- Use rigorous pre-test validation (correlation checks, fit quality assessment)
- Employ multi-model causal inference or similar sophisticated methods
- Achieve similar pre-test fit quality (MAPE <0.15, R² 0.85-0.94)
Your results may differ if you:
- Use simpler methods (single-model, weak validation)
- Have poor pre-test fit
- Test in international markets or non-DTC contexts
Statistical significance rates may be lower (60-75%) with less sophisticated approaches, but iROAS medians should directionally apply.
How much should I spend monthly to test at different levels?
Every $50K/month in total spend opens access to next testing level. However it is important to remember, the biggest factor in reaching statistical significance is conversion volume in each region. Granular testing with insufficient budget produces inconclusive results.
What's a scale test and when should I run one?
Scale test design (3 cells):
- Cell A (Control): Maintain current spend (e.g., $50K)
- Cell B: Increase 250% (e.g., $125K)
- Cell C: Increase 500% (e.g., $250K)
Measures: Marginal ROAS at each spend level to map diminishing returns curve.
Run scale test when:
- You've validated channel iROAS is profitable
- You want to understand how much MORE to spend
- You're deciding between scaling Channel A vs Channel B
- You need to map the full efficiency curve
Don't run scale test when:
- You haven't established baseline channel iROAS yet
- Monthly spend <$100K (insufficient power)
- Current iROAS is already unprofitable
Should I use State-level, DMA-level, or ZIP-level geographic randomization?
State-level (~65% of tests in this dataset):
- Pros: Reduces geographic spillover, easier logistics
- Cons: Requires larger budgets, fewer location combinations
- Best for: Brands with $100K+ monthly spend, upper-funnel tests
DMA-level (~30% of tests):
- Pros: More precision, more location options
- Cons: Higher spillover risk
- Best for: Brands with $50-100K monthly spend, balanced approach
ZIP/Cluster-level (~5% of tests):
- Pros: Maximum precision, very granular
- Cons: Highest spillover risk, complex logistics
- Best for: Very large budgets ($200K+), hyperlocal businesses
Most brands should start with State-level to reduce spillover, then move to DMA-level as they gain sophistication.
Technical Appendix
Confidence Interval Estimation
Confidence intervals constructed using blocked bootstrap resampling to account for time series autocorrelation:
Procedure:
- Block Size Selection: 7-day blocks to preserve weekly seasonality patterns and autocorrelation structure.
- Resampling (1,000 iterations):
- Randomly sample blocks with replacement from pre-treatment residual series
- Reconstruct full residual series from sampled blocks
- Add residuals to fitted counterfactual to generate bootstrap revenue series
- Recalculate incremental revenue and iROAS for this bootstrap sample
- Interval Construction: 95% confidence interval represents 2.5th and 97.5th percentiles of 1,000 bootstrap iROAS values.
- Autocorrelation Handling: By resampling blocks rather than individual days, we preserve temporal correlation structure and avoid artificially narrow confidence intervals.
This follows best practices for time series bootstrap (Politis & Romano, 1994).
Power Analysis
Pre-test power calculations used standard formula:
n = (Z_α/2 + Z_β)² × (σ²_treatment + σ²_control) / (MDE × baseline_mean)²
Where:
- Z_α/2 = 1.645 (for 90% confidence level, two-tailed)
- Z_β = 0.842 (for 80% power)
- σ² = variance of daily revenue in pre-treatment period
- MDE = minimum detectable effect (typically 20% lift)
- baseline_mean = mean daily revenue in control group
Stella's platform calculates this automatically during pre-test validation.
References
Abadie, A., & Gardeazabal, J. (2003). The economic costs of conflict: A case study of the Basque Country. American Economic Review, 93(1), 113-132. https://doi.org/10.1257/000282803321455188
Abadie, A., Diamond, A., & Hainmueller, J. (2010). Synthetic control methods for comparative case studies: Estimating the effect of California's tobacco control program. Journal of the American Statistical Association, 105(490), 493-505. https://doi.org/10.1198/jasa.2009.ap08746
Brodersen, K. H., Gallusser, F., Koehler, J., Remy, N., & Scott, S. L. (2015). Inferring causal impact using Bayesian structural time-series models. The Annals of Applied Statistics, 9(1), 247-274. https://doi.org/10.1214/14-AOAS788
Gordon, B. R., Zettelmeyer, F., Bhargava, N., & Chapsky, D. (2019). A comparison of approaches to advertising measurement: Evidence from big field experiments at Facebook. Marketing Science, 38(2), 193-225. https://doi.org/10.1287/mksc.2018.1135
Lewis, R. A., & Rao, J. M. (2015). The unfavorable economics of measuring the returns to advertising. The Quarterly Journal of Economics, 130(4), 1941-1973. https://doi.org/10.1093/qje/qjv023
Politis, D. N., & Romano, J. P. (1994). The stationary bootstrap. Journal of the American Statistical Association, 89(428), 1303-1313. https://doi.org/10.1080/01621459.1994.10476870
%20(5).png)
.png)
%20(4).png)
.png)