Incrementality Testing in Marketing: Guide For Advanced Marketing Leaders
Updated June 2026
Most incrementality guides stop at the part that feels rigorous.
They explain test groups, control groups, holdouts, and lift. They show you how to calculate the difference between what happened and what would have happened without the campaign.
That is useful. It is also incomplete.
Because the question advanced marketing leaders are actually asking is not "what is incrementality?"
It is: Can I defend this number when someone asks me to move real budget?
A lift result by itself does not answer that. A 2.4x iROAS can be actionable, or meaningless depending on the test design behind it. Was the test powered? Did the markets match before the intervention? Was the control contaminated? How wide was the confidence interval? Did the model pass a placebo test? Did anyone decide what would change if the result came back strong, weak, or inconclusive?
This is where most incrementality work breaks. Not because causality is the wrong goal, but because teams treat the result as the deliverable.
The result is not the deliverable.
The budget decision is.
What does incrementality testing actually measure?
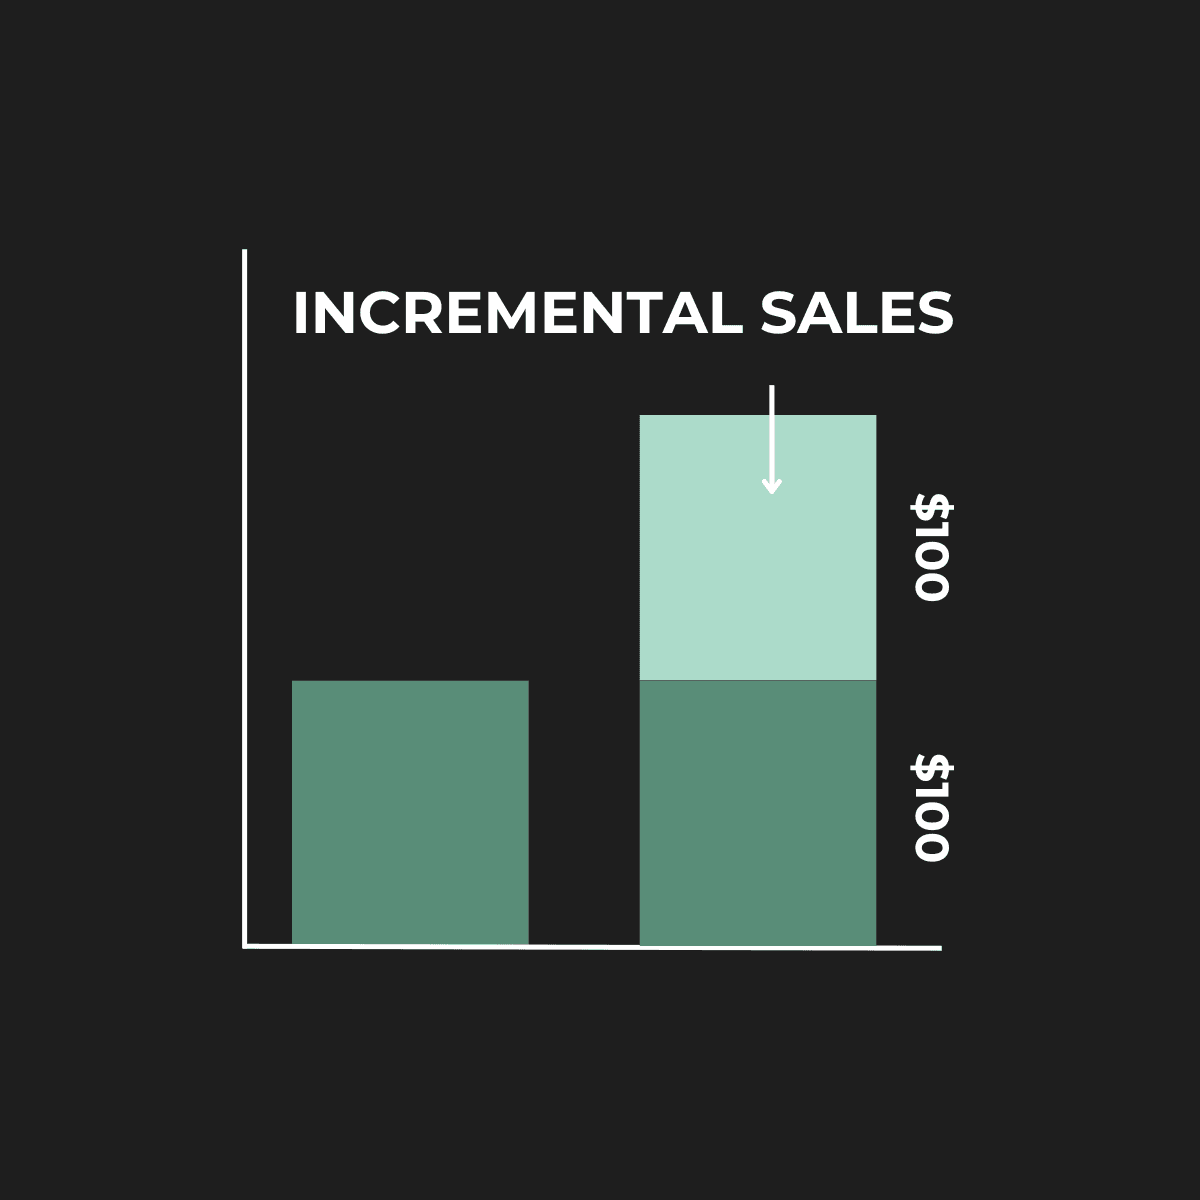
Incrementality testing estimates what your marketing caused above the baseline of what would have happened anyway.
That sounds simple. It is not. The baseline is the entire problem.
Attribution does not estimate that baseline. It assigns algorithmic credit based on observed touchpoints near conversion. This is particularly problematic for branded search, retargeting, and high-intent audiences, where the platform records touchpoints near purchase from customers who were likely to convert regardless. The platform sees the customer near the purchase. It does not know whether the customer needed the ad to buy.
Incrementality testing tries to answer the counterfactual: what would have happened without the marketing?
That is why the method matters. But a geo holdout is not a randomized controlled experiment. It is a quasi-experiment. The causal identification relies on assumptions: that geographic units are sufficiently independent, that treatment effects do not spill across borders, and that the synthetic control or matched markets provide a valid counterfactual. When those assumptions hold, geo holdouts produce well-identified causal estimates with quantified uncertainty. When they do not, the result can mislead you just as confidently as attribution, with better vocabulary.
Gordon et al. (2019, Marketing Science) documented the attribution problem at scale, using 15 U.S. Facebook advertising field experiments. The observational methods tested in that study consistently failed to recover experimental treatment effects, even after conditioning on extensive demographic and behavioral variables. That finding is specific to the methods and context studied, but the underlying problem applies broadly: attribution methods that cannot account for selection into ad exposure cannot reliably estimate causal effects.
Incrementality is a budget system, not a reporting method
Most marketing measurement starts from the wrong question.
Attribution asks: which touchpoint gets credit?
Incrementality asks: what changed because we spent the money?
But advanced marketing leaders need a third question: what should we do differently now that we know?
That is the question that separates reporting from measurement.
A test that estimates Meta drove incremental revenue but does not change the Meta budget is not a measurement win. It is a better-looking dashboard. A holdout showing branded search generates below-breakeven incremental ROAS, which is what Stella's benchmark finds across DTC brands on average, leaves the branded search budget untouched. Note that branded search incrementality varies substantially by brand awareness and category: brands with low organic search presence often find branded search more incremental than the benchmark average suggests. A new-customer revenue readout showing a channel is profitable on total revenue but weak on acquisition is only useful if the team changes the target, the budget, or the role of that channel.
This is the standard advanced teams should hold incrementality to:
A result is not finished until it changes at least one of five things: budget, platform targets, channel role, MMM priors, or the next test.
Everything in this guide flows from that.
What question are you actually trying to answer?
Before designing a test, name the decision. This sounds obvious. Almost nobody does it.
"Did our Meta ads work?" is not a testable question. "Did our Meta prospecting campaigns generate revenue above organic baseline in these matched markets at this spend level during this window?" is.
The decision determines everything downstream: the right estimand, the right design, the right markets, and the right interpretation of the result.
| Decision | The right estimand |
|---|---|
| Pause or scale a channel | Total incremental revenue in test period |
| Defend spend to finance | Incremental revenue vs. organic baseline |
| Allocate across channels | Marginal iROAS by channel at current spend |
| Calibrate your MMM | Channel-level lift factor as a prior |
| Evaluate a new tactic | Incremental orders, new customers, or contribution margin |
| Justify upper-funnel spend | Lift in downstream conversions with lag |
If you run a test without being clear on which row you are answering, you will get a number. You probably will not get a decision.
New-customer revenue and total revenue can point in opposite directions. A campaign that drives a lot of repeat purchasers may look strong on total revenue and weak on customer acquisition. When contribution margin data is available and clean at the order level, it is generally a more decision-relevant estimand than revenue, because it accounts for differences in product mix and margin structure that revenue masks. A 2.5x iROAS on a 20% margin product and a 2.5x iROAS on a 60% margin product require completely different budget conclusions. If contribution margin data is unavailable, revenue remains a valid proxy, with the caveat that channel mix differences in product type can confound the comparison.
Name the decision first. Then design the test.
The Decision Grade Incrementality Standard
A test is not a decision grade because it produced a lift number.
In Stella's experience running geo holdouts across DTC brands, the failure mode is rarely statistical. It is almost always definitional: the team ran the test without a pre-specified decision rule. Nobody agreed on what a 1.2x result meant versus a 2.8x result versus an inconclusive result before the test launched. The number came back and the meeting became a negotiation.
A test is decision-grade when five things are true:
| Standard | What it proves |
|---|---|
| Clear decision | The test was designed around a real budget question, not curiosity. |
| Correct estimand | The outcome matches the decision: revenue, contribution margin, new customers, pipeline, or LTV. |
| Valid counterfactual | The control group or synthetic control credibly represents what would have happened without the campaign. |
| Visible uncertainty | The result includes a confidence interval or credible interval, not just a point estimate. |
| Action rule | The team knows what will change if the result lands above, below, or inside a given range, before the test runs. |
That last one is the one almost every team skips. If you do not know what you will do with each possible outcome before the test runs, you are not running a measurement program. You are measuring so you can see what happened. That is reporting. Measurement requires a decision rule.
Which test design fits which decision?
The right design depends on what you can control. Geo holdouts work for most DTC brands with sufficient conversion volume. User-level holdouts work for owned channels. Platform lift tools give a fast directional read when you cannot run an independent test. Synthetic control is the strongest option when markets cannot be cleanly paired. Choosing the wrong design does not just produce random error. It can produce a systematically biased estimate that looks clean.
One constraint worth stating plainly: geo holdouts require sufficient baseline conversion volume in both test and control regions to achieve statistical power. For brands below roughly $1M in monthly ad spend, or with fewer than 100 to 150 daily conversions, the minimum detectable effect in a geo design is often larger than the true effect. The test will come back inconclusive not because the channel is not working but because the test was not viable at that scale. Know your volume before you choose your design.
Geo holdout. You run the campaign in some geographic markets and withhold it from matched others. Works well for most DTC brands with sufficient conversion volume running Meta or Google across a broad geography. The key vulnerability is contamination: if ads leak across geo borders through CTV, social retargeting, or branded search spillover, the control group is not actually untreated.
Inverse geo holdout. You run campaigns everywhere, then pause spend in a subset of matched markets and measure the revenue drop. Operationally easier when turning off is simpler than turning on. Same contamination risks. Good fit when always-on spend makes a clean forward holdout disruptive.
User-level holdout. Works cleanly for email, SMS, and owned channels where you control exposure at the individual level. For paid social, it is messier: Meta's delivery system optimizes across the full audience, so a user assigned to the holdout group may still see ads through a different campaign or objective. This divergent delivery can attenuate estimated lift or produce biased estimates depending on how delivery shifts during the test.
Platform lift study. Meta Conversion Lift, Google Conversion Lift, TikTok's native tool. Free, fast, and directional. The platform controls the experimental design, the delivery, and the reporting. That does not make the result useless. It means the test is not fully independent, and the identifying assumptions are the platform's, not yours. Useful for a fast channel-level signal. Not sufficient alone for a major budget reallocation.
Synthetic control. Builds a weighted blend of untreated markets to construct the best possible counterfactual for your test market. Strongest when markets are hard to pair one-to-one. Requires enough donor markets to build a stable blend and a long enough pre-period to validate the weights. Stella uses weighted synthetic control alongside BSTS and GeoLift as a multi-model validation approach, because point estimates from a single model can be sensitive to pre-period length, donor pool selection, and hyperparameter choices. Convergence across independently specified models on the same data provides stronger evidence than any single model in isolation
No design is universally best. The right design is the one that cleanly isolates the causal effect you are trying to estimate, under assumptions that can be checked, in markets you have access to, at a spend level and conversion volume that supports the required statistical power.
What can break a test before you see the results?
The five most common failure modes are low statistical power, poorly matched markets, contamination of the control group, promotional or seasonal overlap during the test window, and budget reallocation mid-test. Any one of them can produce a confident result that answers the wrong question.
Low statistical power. The test was not powered to detect the effect size that actually matters for the decision. A test with insufficient conversion volume during the window will come back inconclusive. Teams interpret inconclusive as "it didn't work." The actual finding is "we didn't run a test capable of detecting whether it worked." Power is a function of baseline conversion volume, the minimum detectable effect, and test duration. Calculate it before you launch, not after.
Market mismatch. Test and control markets that behave differently before the test starts will produce a result that reflects the mismatch, not the campaign. Portland and Austin with similar historical revenue patterns make a credible pair. Seattle and Miami, with different seasonality, climate, and demand pulses, do not. In Stella's internal benchmark, tests with stronger pre-period fit were more likely to produce interpretable, statistically significant results. Pre-period MAPE and R² are necessary signals of fit quality, but they are not automatic proof. A tight pre-period fit can still fail if the model overfits to noise, the test period behaves differently than the pre-period, or the control group becomes contaminated partway through.
Contamination. A control market that saw the campaign through a different channel is not actually a control. CTV does not respect geographic borders. Branded search retargeting follows users across regions. Retail media spills across DMAs. Contaminated controls almost always bias the estimate toward zero in a positive-lift test: your campaign looks less incremental than it really was.
Promotion or seasonality overlap. A major sale, a product launch, or a seasonal event running in the test region but not the control region will distort the result. Black Friday in the test period, a competitor going out of stock in the control region, a macro news event that hits one geography harder than another. None of these are rare. Plan around them or account for them in the model.
Budget reallocation during the test. Someone on the buying team sees a region underperforming and shifts budget to compensate. Now the holdout region has a different spend mix than it did at launch, and the test is compromised. This happens more often than anyone admits, usually because the person making the reallocation does not know a test is running. Operational lockdown during the test window is not optional.
A holdout is not proof. A well-designed holdout with clean pre-period fit, controlled contamination, adequate power, and no disruptions is proof. The design is the measurement.
What every vendor should show before you trust the result
A serious incrementality readout should not start with the iROAS.
It should start with the receipt.
Before you see the lift number, a credible vendor should be able to show you all of the following:
1. The decision the test was designed to answer. If this is not written down before the test ran, the test was designed for curiosity, not a budget decision.
2. The test and control construction. Which markets, which channels, which spend levels, and why those specific choices.
3. The pre-period fit. How well did the control track the test market before the intervention? MAPE and R² on the pre-period are the right lens. Context matters: acceptable fit quality depends on revenue series volatility, industry seasonality, and test length. What you are looking for is a synthetic control that closely mirrors the test market in the pre-period, so the divergence during the test window is credibly attributable to the campaign rather than to pre-existing differences.
4. The minimum detectable effect. Was the test powered to detect an effect size that would actually change your decision? If not, an inconclusive result tells you nothing about whether the channel is working.
5. The confidence interval. A 2.1x result with a 90% confidence interval from 0.8x to 3.4x spans breakeven to strongly positive. Whether that is actionable depends entirely on where your required return sits relative to the lower bound. A 2.1x result with an interval from 1.6x to 2.6x is precise enough to evaluate against your hurdle rate. Always read the range. The range is the decision, not the headline.
6. The placebo test. Run the model on a pre-campaign period, as if the campaign had run then. A clean methodology should find no lift when there was no campaign. If it finds strong lift in a period with no intervention, the model has a specification problem. Ask for this explicitly: it is infrequently included in standard readouts.
7. The sensitivity analysis. What happens to the estimate if you change the pre-period length, the donor pool composition, or the model hyperparameters? A result that moves dramatically under small specification changes is not stable enough to act on.
8. The action rule. What changes if the result lands at 1.2x? At 2.8x? Inconclusive? If the vendor cannot answer this, the engagement was designed to produce a report, not a decision.
9. Why the result could be wrong. A vendor who cannot explain the conditions under which their result fails does not understand the result well enough for you to bet budget on it.
If all you receive is a lift percentage and a recommendation, you are still being asked to trust a black box. It just has better vocabulary than attribution.
For a full framework on evaluating a measurement partner's methodology, see how to vet a marketing measurement consultancy.
What do you do after the result comes back?
The test is not the deliverable. The budget decision is.
A result that does not change a single line in your media plan is reporting with better math. If you ran a geo holdout and your budget looks exactly the same three weeks later, either every channel was already perfectly funded, which never happens, or the result never made it out of the slide deck.
Here are five things a decision-grade result should actually do.
Calibrate platform ROAS targets. If your geo holdout finds that Meta's incrementality factor is 60%, meaning roughly 60% of platform-attributed conversions were causally driven by the ads, and your current platform ROAS is 3.5x, the implied iROAS is approximately 2.1x. Your ROAS target should be set so that, after applying the incrementality factor, the implied iROAS clears your required return. Setting the ROAS target equal to the iROAS directly is not the right translation: the two metrics are calculated on different revenue bases. A vendor who cannot explain this conversion is not doing measurement.
Reallocate budget at the tested spend level. A strong result on a channel is an argument for more budget, but only up to the spend level the test validated. The test estimates the average treatment effect at the spend level during the test window. The channel's response curve above that spend level is unknown. Scaling aggressively beyond the tested range goes into territory the test did not cover. A weak result is an argument to cut, or to hold and retest before committing further.
Update your MMM priors. An incrementality test result is the strongest input you can give a media mix model, because it provides causal evidence rather than historical correlation alone. In Analytic Edge's published research on Meta MMM calibration, uncalibrated models showed an average 25% change in ROI estimates after being calibrated against lift experiments. Note that the quality of this update depends on whether the holdout and the MMM are estimating the same quantity, over the same population, at similar spend levels, and under comparable market conditions. Imposing a holdout result as a prior when the test conditions differ materially from the MMM's data range can narrow the model's uncertainty in the wrong direction. Use the holdout as a calibration anchor, not as a constraint.
Schedule the retest. An incrementality result has a shelf life. Creative fatigues. Auction dynamics shift. Competitors enter and exit. Spend scales past the tested level. The causal effect of a channel at $200K/month in January may differ from its effect at $350K/month in September. The question is not whether to retest. It is how long you can rely on the current estimate before the conditions that produced it have changed enough to make it unreliable.
Document the reasoning if you held the line. If the result came back and you did not change anything, write down why. Not for compliance. Because in six months you will not remember whether you held the line because the confidence interval was too wide, because the result was inconclusive, or because the channel owner argued you out of it. The discipline of writing the decision down is the discipline of treating measurement as a management system.
Why one test is not a measurement program
Here is the most expensive mistake marketing leaders make with incrementality: running a good test, getting a well-identified causal estimate, acting on it once, and treating that estimate as permanent.
Every causal estimate becomes less reliable as market conditions change.
Consider a pattern Stella observes across DTC brands. A brand tests Meta prospecting in Q1 and finds 70% of attributed conversions are incremental. Clean test, well powered, matched markets. They double the budget based on that estimate. By Q3, the true incrementality factor may be closer to 35%, for reasons that are individually plausible and collectively invisible in the platform data. The creative that carried Q1 has been in market for seven months and audience saturation has increased. A competitor entered the auction in May and CPMs are higher. And the scaled spend is now well above the level that was tested, potentially past the point of diminishing marginal returns. The Q1 estimate was valid when it was measured. The conditions that produced it are not the conditions in Q3.
This is what Stella's CCO framework calls Causal Decay: the process by which the market conditions underlying a causal estimate shift over time, making the estimate progressively less reliable as a basis for current decisions. Platform ROAS responds to some of these forces, because creative fatigue and auction pressure affect attributed conversion volume and efficiency. What it cannot detect is whether the proportion of those conversions that are causally incremental has changed. A channel can maintain a stable attributed ROAS while its true incrementality declines, because platform attribution cannot distinguish incremental from non-incremental conversions.
The fix is not running more tests on a calendar. Calendar-driven testing wastes experimentation budget on ritual: re-testing the stable channel because it is Q3 and that is the schedule, while the channel that actually changed three weeks ago waits its turn. Calendars do not know what changed. Uncertainty does.
A complete measurement system has three layers working as a loop. Geo holdouts provide well-identified causal estimates under stated assumptions. A calibrated MMM extends those estimates across the full media mix, handling cross-channel allocation and the channels that cannot be tested in every window. Always-on monitoring tracks the uncertainty around current estimates and flags when conditions have shifted enough that a retest is needed, based on evidence of drift rather than a calendar date.
This is the Continuous Causal Optimization framework. The argument for it is not that it is more rigorous in any single test. It is that a single static estimate applied to a dynamic market degrades in reliability over time, and a system that monitors for that degradation and responds to it will make better budget decisions over a full planning cycle than a system that retests on a fixed schedule. For the full argument, including how AI bidding systems raise the stakes for brands feeding them stale causal signals, read The Continuous Causal Optimization Manifesto.
FAQ
What is the difference between incrementality testing and attribution?
Attribution assigns credit based on observed touchpoints near conversion. It cannot distinguish between ads that caused a purchase and ads that appeared near a purchase that would have happened anyway. Incrementality testing estimates the counterfactual: what fraction of conversions required the ad to occur. A customer who clicked a branded search ad after already deciding to buy will be attributed to that ad. A geo holdout comparing markets with and without the branded search campaign would estimate whether those markets saw meaningfully different conversion rates, net of other factors. The two methods are answering different questions, and using attribution to make budget decisions assumes the credit allocation reflects causal contribution, which the Gordon et al. field experiments suggest is often not the case.
How do I know if my incrementality test was statistically powered?
Power is a function of baseline conversion volume in the test and control markets, the minimum effect size you need to detect, and the test duration. An underpowered test produces an inconclusive result, which looks like the campaign did not work but actually means the test could not see whether it worked. Calculate the minimum detectable effect before you launch. If the MDE at your available sample size and duration is larger than the effect size that would actually change your decision, the test is not viable at that scale. For geo holdouts, a rough floor is 100 to 150 daily conversions in the test region, though the right number depends on the variance of your revenue series and the effect size you are trying to detect.
What is iROAS and how does it differ from platform ROAS?
Platform ROAS is the revenue a platform attributes to its own ads, divided by spend. It counts any conversion that happened near an ad, regardless of whether the ad caused the conversion. iROAS (incremental return on ad spend) is the revenue estimated to have been caused by the ads, as measured by a controlled experiment, divided by spend. These are calculated on different revenue bases and should not be set equal to each other when calibrating platform targets. For channels with high brand demand capture, like branded search or retargeting, the gap between platform ROAS and iROAS can be substantial. Across 225 geo-based incrementality tests on DTC brands in Stella's internal benchmark, a self-selected dataset of brands that chose to run geo holdouts on the Stella platform, not a representative sample of all DTC advertisers, the median iROAS was 2.31x, with the middle 50% of tests between 1.36x and 3.24x.
Can you run incrementality testing without user-level tracking?
Yes. Geo holdout tests and media mix models operate on aggregated revenue and spend data by geography and time period. They do not depend on cookies, device IDs, or user-level tracking. That matters because user-level attribution signal has become less reliable across privacy changes, browser restrictions, platform limitations, and consent behavior. The exact timelines around cookies and privacy APIs have shifted repeatedly. The strategic point has not: measurement methods that require accurate user-level tracking are fragile as tracking degrades. Geo-based and aggregated methods are not.
What diagnostics should I ask a measurement vendor to show me?
Ask for the pre-period fit between test and control markets, expressed as MAPE and R² with enough context to evaluate them against the volatility of your revenue series. Ask for the minimum detectable effect so you know whether the test was powered for your decision. Ask for the full confidence interval, not just the point estimate, and ask where your required return sits relative to the lower bound specifically. Ask for a placebo test showing the model finds no lift in a period with no campaign. Ask for a sensitivity analysis showing how the estimate changes under different pre-period lengths and donor pool compositions. Then ask under what conditions the result could be wrong. A vendor who cannot answer that last question is asking you to trust a number they cannot fully audit themselves.
Ready to see the receipt behind the number?
Most incrementality work ends with a lift estimate.
Stella starts there, then shows whether the estimate is well-identified enough to act on.
Every Stella result includes the test design, the control construction, the pre-period fit, the uncertainty, the model error, and the budget implication. Not because it makes the report longer. Because a number without the receipt is just another number someone has to trust on faith.
Book a demo with Stella to see what decision-grade incrementality looks like.