You Just Ran a MMM, Now What? Understanding Media Mix Modeling for Advanced Marketing Leaders

Updated May 2026
You just got back an MMM with a 0.92 R-squared and a clean deck. There's roughly a 25% chance the model is wrong, because R-squared has almost nothing to do with whether your MMM will help you make better budget decisions. The actual validation work happens after the model is built. You need out-of-sample MAPE under 20%, VIF under 10 on every channel, business-logic sanity checks, and at least one experimental calibration before you move real budget.
What's actually wrong with most MMMs?
Short answer: They're built to fit history, not to predict the future or estimate causal effects. A model that fits your last three years of data perfectly can still be useless for deciding next quarter's budget. The industry knows this. The marketers who actually trust their measurement are the ones who validate against experiments, not against R-squared.
You spent six months and a meaningful chunk of budget. The consultant delivered a deck. Channel-level ROIs, saturation curves, recommended reallocations. R-squared is 0.92. The deck looks great.
Then it sits on a shelf.
This is the part of MMM nobody warns you about. According to Analytic Edge's published research on calibration, uncalibrated MMMs show an average 25% change in ROI after being calibrated against lift experiments. Industry surveys consistently find that only a small share of marketers say their current measurement solution does what they need. Nearly 70% of mid-market companies still can't reliably tie marketing to the bottom line.
The model is the easy part. Knowing whether to trust it is the whole job.
For a broader take on how MMM fits with experiments and attribution, see Stella's complete guide to incrementality testing platforms.
Why is a high R-squared not the answer?
Short answer: R-squared measures how well a model fits the data it was trained on. That's a measure of memorization, not understanding. A model can hit 0.95 R-squared by absorbing noise, holiday spikes, and proxy variables that have nothing to do with marketing causality. High R-squared on MMM is often a red flag, not a green one.
Google's own Meridian documentation says it plainly: there is no R-squared threshold that makes a model good or bad. A model with 99% out-of-sample R-squared can still be a poor model for causal inference.
The reason is mechanical. R-squared rewards any variable that correlates with revenue. Add a few dummy variables for Black Friday, branded search, weather, holidays. R-squared climbs. None of that tells you whether your Meta spend is actually moving sales.
Typical MMM R-squared values land between 0.85 and 0.95. Above 0.95 is usually a sign the model has overfit. But anywhere in that band, R-squared alone tells you nothing about whether the model will help you decide where to put next quarter's budget.
The shift in modern MMM practice is simple to state and hard to do. Validate externally through experiments and out-of-sample prediction. Not internally through goodness-of-fit.
What experimental calibration does to MMM accuracy
Uncalibrated MMMs average 13% MAPE (87% accuracy). With iROAS calibration from integrated experiments, MAPE drops to 5% and accuracy hits 95%.
What metrics actually matter?
Short answer: Four numbers. MAPE for prediction accuracy. VIF for whether your channels are too correlated to separate cleanly. Out-of-sample performance for whether the model generalizes. And experimental calibration results for whether the model agrees with reality. If any of those four look bad, you don't have a usable model yet.
The four MMM diagnostics that matter
Move each slider to see how the diagnostic score shifts. The verdict at the bottom updates based on all four.
MAPE (Mean Absolute Percentage Error)
MAPE tells you how far off the model's predictions are, in percentage terms.
- In-sample MAPE: 5 to 15% for a well-specified model
- Out-of-sample MAPE: under 15 to 20% is strong, under 10% is exceptional
- Above 30% is a red flag that something is structurally wrong
Nielsen has reported regional models hitting 4% MAPE versus 7% at the national level. As a benchmark from production data, Stella's MMM averages 13% MAPE in forward tests without calibration, and 5% with iROAS calibration from integrated experiments. That works out to roughly 87% prediction accuracy uncalibrated, 95% calibrated.
VIF (Variance Inflation Factor)
VIF addresses the hardest technical problem in MMM: multicollinearity. Most brands scale spend across channels at the same time. TV, digital, and social all spike during the holidays. The model struggles to figure out which channel actually drove the sale.
The practical consequence is brutal. Channel ROIs can swing wildly or flip signs between model runs. Credit shifts arbitrarily between correlated channels.
- VIF below 5: clean
- VIF 5 to 10: caution
- VIF above 10: the model cannot reliably separate those channels
The long-term fix is intentional spend variation across channels to break natural correlations. That takes organizational buy-in, but nothing else works as well.
Out-of-sample performance
This is where competent MMM diverges from amateur work. In-sample metrics evaluate the model on data it has already seen. Overfit models pass that test effortlessly. Out-of-sample testing checks whether the model has learned actual causal drivers or memorized historical noise.
The standard approach:
- Hold out the last 26 weeks of a 3-year dataset
- Test predictions at 30, 60, and 90 days forward
- Confirm every holdout period hits under 20% MAPE
- Splits must be chronological, not random. Time-series data has temporal dependencies that random splits destroy.
Experimental calibration
This is the gold standard. Experiments give you causal ground truth that no observational model can produce alone.
Three flavors:
- People-based lift tests like Meta Conversion Lift or Google Conversion Lift
- Geo-based experiments, randomizing marketing across regions
- Time-based holdouts where you turn a channel completely off
Meta's Robyn 2022 Hackathon showed that calibrated models produce ROAS estimates closer to experimental truth, and that calibrating even a single channel improves estimates across every other channel.
Expected alignment is 15 to 30% between MMM and experiments. That's normal because they estimate slightly different things. Above 50% means something is wrong with the model.
When MMM and a well-run experiment disagree, the experiment is usually right.
For a real-world example of using experiments to validate a tricky channel, see Stella's 6-month podcast ad incrementality study.
How do you actually validate an MMM?
Short answer: Run it through both a statistical check and a business-logic check, then validate at least one channel against an experiment before you move real money. Most teams skip the business-logic and experimental steps. That's why most MMMs never produce action.
The validation table
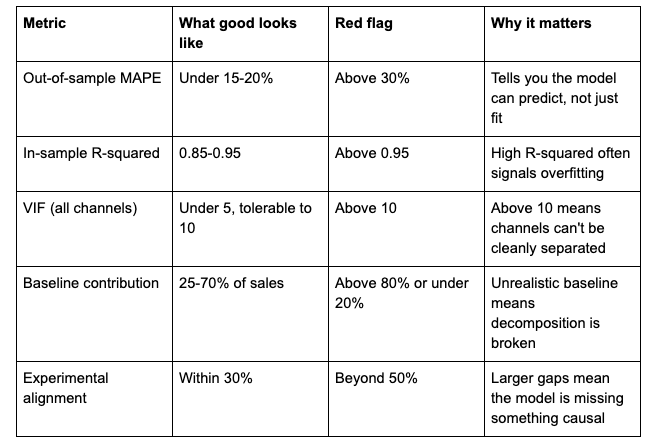
Business-logic checks
Statistics alone aren't enough. Your model also has to make sense.
- Spend vs contribution alignment. A channel taking 80% of budget but showing 0% effect is wrong unless you have strong experimental evidence of zero incrementality.
- Seasonality. Model-estimated seasonal effects should match known patterns. Black Friday should look like Black Friday.
- Diminishing returns. Saturation curves should bend. Linear or accelerating returns at scale means the curve wasn't modeled.
- Cross-channel consistency. If your model says Meta has 10x the ROAS of Google but you're maxed out on Meta, the model didn't capture constraints.
Experimental validation
The minimum bar is one experiment before any major budget shift. The standard for a mature program is two to four experiments per year across different channels.
The classic example: Uber's analytics team suspected Meta rider-acquisition ads were non-incremental. An MMM flagged it. An incrementality test confirmed it. Three months with Meta ads turned off showed no drop in riders. They reallocated $35M annually to higher-ROI opportunities.
That's the full cycle. Observation, experiment, action, measurement. Most MMM programs stop at step one.
How do the major MMM vendors actually validate?
Short answer: Meta's Robyn optimizes three error functions at once and penalizes models that produce politically unrealistic decompositions. Google's Meridian uses Bayesian inference with experimental priors and explicitly prioritizes causal inference over prediction accuracy. The newer entrants treat MMM as continuously validated software, with live accuracy tracking against actuals at 7, 30, 60, and 90 days. All three approaches share one thing: they treat the model as wrong until proven correct.
Meta's Robyn
Robyn minimizes three error functions simultaneously:
- NRMSE for prediction error
- DECOMP.RSSD for business error, measuring how closely spend share and effect share align
- MAPE.LIFT for calibration error against experimental results
It generates thousands of candidate models and finds Pareto-optimal solutions across those three objectives.
The controversial piece is DECOMP.RSSD. It penalizes models where budget allocation and effect allocation diverge wildly. Critics call this optimizing for politics. Defenders argue it prevents the model from producing unactionable results that nobody will trust enough to act on.
Google's Meridian
Meridian takes a Bayesian approach with automated diagnostic checks that produce PASS, REVIEW, or FAIL statuses.
Its philosophy is different from prediction-focused tools. The Meridian docs state directly that the goal in MMM is causal inference, not minimizing out-of-sample prediction metrics. They argue it can be safer to overfit if the model includes all relevant confounders.
This is a real epistemological split in the field. Prediction-first vs causation-first. Both camps have defensible arguments.
Meridian's primary calibration mechanism is ROI priors derived from experiments. You translate experimental findings into Bayesian priors that constrain the model. That's a clean way to bake causal knowledge into an observational framework.
Continuous validation approaches
A newer school treats all MMM results as wrong until proven correct. Some vendors reject in-sample metrics entirely.
The validation framework usually has three pillars:
- Conversion lift studies as ground truth
- Holdout forecasting at 7, 30, 60, and 90 days
- Dynamic budget optimization, where clients act on recommendations and the platform tracks real-world results against the predictions
Every deployed model is snapshotted. Predictions are tracked against actuals at multiple horizons. This live accuracy scoreboard is the most operationally mature validation approach in the industry.
Why do 70% of MMMs never drive action?
Short answer: It isn't a math problem. It's an organizational problem. The model gets built, the deck gets delivered, and then it dies in the gap between analytics and media buying. The brands that close this gap share five traits: executive sponsorship, cross-functional governance, experimental validation, scenario planning tied to the P&L, and always-on architecture.
The core barriers, in order of how often we see them:
Siloed ownership. MMM lives in analytics, disconnected from the team that actually places media. Insights get delivered but never integrated.
Timing mismatch. Traditional MMMs deliver results months after the fact. By the time you have the answer, budgets have already moved.
Conflict of interest. When the person building the model also controls a channel's budget, results get manipulated. One practitioner described a case where the person running the model also bought the TV media and conveniently made TV look like the hero.
No experimental validation. Without proof that model predictions match real outcomes, stakeholders won't make large budget shifts.
No feedback loop. Recommendations get made, but nobody tracks whether acting on them actually produced the predicted result. So nobody learns.
What the brands that figure it out do differently
Analytic Partners' ROI Genome, drawn from over 1,000 brands across 50 countries, found that companies that combine measurement with scenario planning achieve 25 to 70% gains in ROI. Organizations using advanced commercial analytics reallocate budgets 2 to 3x more effectively than those using basic methods.
McDonald's used geo-testing to validate their MMM's estimate of Meta's contribution. Grounding the correlational MMM finding in causal evidence let them confidently move budget.
The shift toward always-on, SaaS-based MMM directly addresses the timing problem. Weekly or monthly model refreshes replace year-long project cycles. By the time the model has an answer, the answer is still relevant.
What does the modern measurement stack look like?
Short answer: Triangulation. MMM for strategic budget allocation and long-term planning. Incrementality experiments for causal ground truth on specific channels. Platform attribution for tactical daily optimization. No single method does all three jobs well, and any team trying to use one method for all three is going to miss something.
The three-method framework:
- MMM: strategic budget allocation, quarterly to annual cadence
- Incrementality experiments: causal validation, ongoing program of 2 to 4 tests per channel per year
- Platform attribution: real-time tactical optimization, with the understanding that the platform is grading its own homework
Ekimetrics describes MMM as the glue, the method through which all other methods get integrated.
The IAB's December 2025 "Modernizing MMM" guidance recommends weekly data refreshes, monthly to quarterly model retrains, and experimental calibration at least annually. That's a significant acceleration from the annual refresh cycle that defined traditional MMM.
What's your action plan after you receive an MMM?
Short answer: Spend the first two weeks on statistical and business-logic validation. Use weeks three and four to design experimental validation on one or two key channels. Run the experiments over the next two months. Pilot a small budget reallocation in month four. Set up continuous validation from month five on. Do not move major budget on an unvalidated model.
Week 1: statistical validation
- Review every metric in the validation table above
- Confirm out-of-sample testing was actually performed, not just in-sample fit
- Check VIF on every media variable
- Verify baseline contribution falls between 25 and 70% of total sales
- Confirm saturation curves show diminishing returns
Week 2: business logic review
- Cross-functional review with media buyers, finance, and analytics in the room
- Identify any results that contradict known business patterns
- Compare major channel ROAS estimates against historical performance
- Check whether recommended reallocations are even feasible given IO commitments and budget minimums
Weeks 3 and 4: experimental design
- Pick one or two channels for experimental validation
- Design the geo-holdout or conversion lift study
- Set success criteria. MMM and experiment should align within 30%.
- Get organizational buy-in for the test
Months 2 and 3: run experiments
- Execute the validation tests
- Compare experimental results to MMM predictions
- If the gap is over 50%, investigate model specification before moving budget
- If alignment is good, build confidence for larger shifts
Month 4: pilot reallocation
- Start with small, reversible changes. 5 to 10% of budget.
- Track actual performance against MMM predictions
- Document learnings and refresh the model with new data
- Build the case study before the next quarterly review
Ongoing
- Monthly model refreshes with new data
- Track prediction accuracy at 30, 60, 90 days forward
- Run 2 to 4 experiments per year across different channels
- Integrate MMM outputs into quarterly planning
- Create the feedback loop: decisions to outcomes to model updates
What are the most common MMM mistakes?
Short answer: Trusting in-sample fit, ignoring multicollinearity, skipping experimental validation, leaking information into holdout tests, treating MMM as a one-time project, waiting for the "perfect" model, and ignoring organizational readiness. Most teams make at least three of these mistakes on their first MMM.
Trusting in-sample metrics alone. Your model might fit history perfectly and still be useless for prediction. Validate out-of-sample. Always.
Ignoring multicollinearity. If VIF is over 10, the model cannot reliably separate the correlated channels. Don't trust the individual ROIs. Either inject spend variation or use informative priors.
Skipping experimental validation. Correlation is not causation. An observational model that hasn't been checked against experiments is a hypothesis, not evidence.
Information leakage in holdouts. Including variables tightly coupled to revenue (branded search, website traffic, affiliate spend) in your holdout period invalidates the test. Ask whether you would actually know this variable at the moment of the forecast.
One-and-done modeling. Markets shift. Seasonality moves. New channels emerge. An MMM that isn't continuously updated drifts into wrong within months.
Perfectionism paralysis. Waiting for the perfect model before acting means never acting. Start with experimental validation on one or two channels.
Ignoring organizational readiness. The fanciest Bayesian hierarchical model is worthless if your media buyers don't trust it, don't understand it, or aren't empowered to act on it.
What's changing in MMM right now?
Short answer: Four shifts are happening at once. From annual consulting projects to always-on SaaS. From black-box vendor models to transparent open-source frameworks. From observational to experiment-calibrated. From six-month lag to weekly refreshes. The brands that get ahead of these shifts will have a measurement advantage their competitors literally cannot match without rebuilding.
From annual to always-on. Traditional model: 6 to 12 month project, annual refresh. Modern model: continuous data ingestion, weekly to monthly updates. Recommendations land in time to actually influence in-flight budget decisions.
From black box to transparent. Traditional: vendor builds, client receives PowerPoint. Modern: open-source frameworks like Robyn, Meridian, and PyMC-Marketing. Client-owned models. Full methodology transparency. Marketing teams can actually interrogate the results.
From correlation to causation. Traditional MMM was purely observational. Modern MMM is experiment-calibrated, explicitly separating correlation from causation. The result is confidence to make major reallocations.
From yearly to real-time. Traditional lag: 6 months to build, 3 months outdated by delivery. Modern cadence: weekly data refreshes, monthly retrains, quarterly deep reviews. Insights that align with planning and buying cycles.
How does Stella handle all of this?
Short answer: Stella runs your MMM with the validation metrics built in, lets you calibrate against experiments inside the same platform, and adds an always-on daily incrementality layer that solves the timing problem traditional MMMs can't. The honest accuracy numbers are 87% in forward tests without calibration, 95% with iROAS calibration from integrated experiments.
Stella achieves 87% accuracy on average in forward tests without any calibration, measured on holdout periods the model has never seen. With iROAS calibration from the integrated Experiments tool, that rises to 95% on average.
The workflow:
Upload your data. CSV or Google Sheet. Templates and validation checks are built in.
Run your MMM. Stella runs a multi-model approach (Weighted Synthetic Controls, Aggregated Synthetic Controls, Causal Impact) and produces channel-level ROIs, saturation curves, and every validation metric covered in this guide. MAPE and VIF are calculated automatically with diagnostic warnings.
Calibrate with experiments. The Experiments tool lets you run incrementality tests (geo holdouts, conversion lift) and use the results to calibrate the MMM. iROAS calibration anchors your model to experimental truth. This is where accuracy moves from 87% to 95%.
Always-on measurement. Daily automated causal analysis runs alongside the strategic MMM. A weekly lite MMM calculates baseline. Daily incrementality reads tell you what was truly incremental versus organic, in something close to real time.
The Budget Optimizer handles forward testing (what happens if you shift 20% from Meta to Google) and back testing (would last quarter's strategy have worked in this quarter). All the validation metrics from this guide are automatic, not optional.
Pricing-wise, traditional MMM is a $50K-$150K one-time project with a six-month lag and an annual refresh, owned by the consultant. Stella runs at $3K/month for the Professional plan, with the model owned by you, validated by experiments in the same platform, and refreshed as often as you want.
The point of Stella isn't to be cheaper. It's to make the model usable. Most MMMs fail because the implementation gap kills them. Stella collapses that gap by putting the validation and the action in the same platform.
FAQ
How long does a typical MMM take to build and validate? Traditional consulting MMMs run six to twelve months from kickoff to delivery. Modern SaaS MMMs can produce a first-pass model in days to weeks, depending on data quality. The validation work, including at least one calibration experiment, should add four to eight more weeks before you move major budget.
What data do I need to run a usable MMM? At least two years of weekly marketing spend by channel, weekly revenue, and key control variables (promotions, seasonality markers, distribution changes). Three years is better. Without enough historical variation in spend across channels, multicollinearity will dominate the model and the channel-level ROIs won't be reliable.
Do I need experimental calibration, or is a well-built MMM enough on its own? You need calibration. An observational MMM is a hypothesis. Without experimental validation, you don't know which of its hypotheses are right. The Meta Robyn Hackathon showed that calibrating even one channel improves estimates across every other channel. The downside of running experiments is roughly 10 to 15% of test-channel spend in opportunity cost. The upside is a model your CFO will actually trust.
Can I trust an MMM with high R-squared but no experimental validation? No. R-squared measures fit on historical data. It says nothing about causal accuracy. Google's own Meridian documentation states that a model with 99% out-of-sample R-squared can still be a poor model for causal inference. Validate with experiments before you act.
How often should an MMM be refreshed? The IAB's December 2025 "Modernizing MMM" guidance recommends weekly data refreshes, monthly to quarterly model retrains, and experimental calibration at least annually. The traditional annual refresh cycle is too slow to be useful for in-flight decisions. Any platform you're evaluating should support at least monthly retrains as a default.
What's the takeaway?
The MMM field hit an inflection point. Building a defensible model is no longer the hard part. The infrastructure is mature. The differentiator is validation rigor and organizational integration.
Three things matter more than the model itself.
The most important validation metric isn't a statistic. It's whether acting on the model's recommendations produces the predicted outcome. Real-world validation through budget tests is the only proof that counts.
Demand both predictive accuracy and causal validity. The tension between "prediction first" and "causation first" is real and unresolved in the field. Best practice is to demand both. Reasonable out-of-sample accuracy and experimentally validated causal estimates.
The implementation gap won't close through better models. It closes through structures that make acting on MMM insights the default rather than the exception. Embed model outputs into planning workflows. Tie measurement to P&L accountability. Build the feedback loop.
The 3% satisfaction rate among marketers isn't a technology problem. It's a decision-making problem.
Your MMM should be a decision-making engine, not a reporting tool. Validate rigorously. Act confidently. Measure continuously.