Incrementality Study: How Incremental is Meta Really?
Incrementality Study: How Incremental is Meta Really?
A channel-level analysis of 46 Meta Ads incrementality studies for DTC brands using Stella’s geo-based inverse holdout methodology
Study period: January 2025 to April 2025
Overview
Meta Ads remains one of the largest line items in most DTC media budgets, often responsible for 8 to 15 percent of total revenue. But platform-reported ROAS doesn’t answer the most important question: How much of that revenue actually required paid media to happen?
To find out, Stella ran 46 incrementality studies between January and April 2025 across ecommerce brands with $15M to $100M in annual revenue. These studies isolated the incremental return on Meta spend, or revenue that would not have happened without ads, using Stella’s geo-based inverse holdout methodology.
Methodology
Each brand used Shopify as its ecommerce platform. Stella applied both synthetic control and Bayesian synthetic control models with priors to account for complex purchase behaviors, especially for brands with higher ticket prices or lower daily order volume.
The structure of each study included:
- Test Type: Inverse holdout (ads were turned off in test regions that had previously been live)
- Test Geography: DMA or state-level regions across the United States
- Control Regions: Regions where Meta campaigns remained live throughout the study
- Counterfactual Construction: Predicted revenue in test regions was generated using pre-period trends and validated against synthetic controls
- Pre-period Length: 120 days
- Test Duration: 20 to 30 days
- Post-Treatment Observation: Cooldown period of 14 days to capture delayed purchase behavior
All models passed quality thresholds for inclusion:
- MAPE (mean absolute percentage error): ≤ 12%
- R² (pre-period fit): ≥ 0.75
- Statistical significance (p < 0.10): Reached in 87 percent of studies
Validation Criteria for Trustworthy Studies
We only declare a study valid if all of the following are met:
- Adequate spend and data points to observe potential lift
- Minimum test duration of 2 weekends, regardless of early statistical significance
- Statistical confidence at 90%, 95%, and 99% levels
- Tight confidence intervals on iROAS with low standard deviation (we look for precision, not just significance)
Confounder Adjustment
Stella’s models accept a wide range of confounding variables, email activity, organic search spikes, seasonal events, even promotions, to properly isolate the effect of paid Meta Ads. Most open-source and some commercial solutions assume media is the only driver, which risks false positives.
Study Sample
- Number of brands: 46
- Annual revenue: $15M to $100M
- Average Meta spend: 10 percent of annual revenue (approximately $139K/month for a $16.7M brand, $418K/month for a $50.1M brand)
- Geography: All U.S.-based brands; a few sold internationally, but most revenue was domestic
- AOV: Most brands had average order values under $150
- Attribution settings: Varied across brands, observed when available
- Measurement scope: Only revenue from Shopify stores was included in iROAS calculations
While some participating brands also sold through Amazon or retail channels, this case study focuses exclusively on direct-to-consumer (DTC) revenue. However, Stella has conducted separate studies confirming that Meta can also drive meaningful lift in non-DTC sales channels.
Key Metric: Incremental ROAS (iROAS)
iROAS measures the additional revenue generated because Meta Ads ran. It excludes revenue that would have occurred through organic or other channels. It is calculated as:
iROAS = Incremental Revenue / Meta Spend
Incrementality Factor = iROAS / Platform ROAS
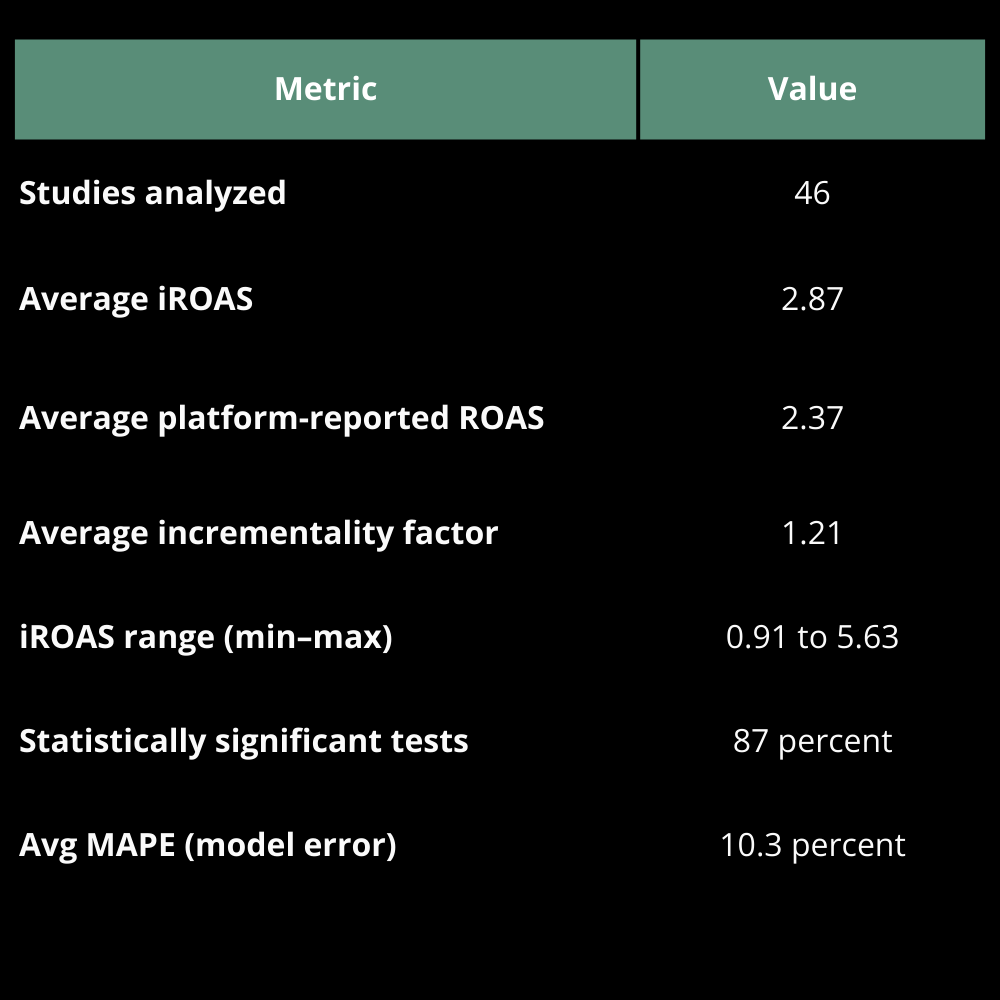
Across the 46 studies, we observed the following averages:
- Average iROAS: 2.87
- Average platform-reported ROAS: 2.37
- Average incrementality factor: 1.21
For consistency, platform ROAS was normalized across all brands to reflect 7-day click and 1-day view attribution, regardless of the in-platform attribution model clients had selected.
This means Meta delivered 21 percent more incremental revenue than what the platform itself reported. For teams using platform ROAS to set performance thresholds, this gap represents a critical adjustment point.
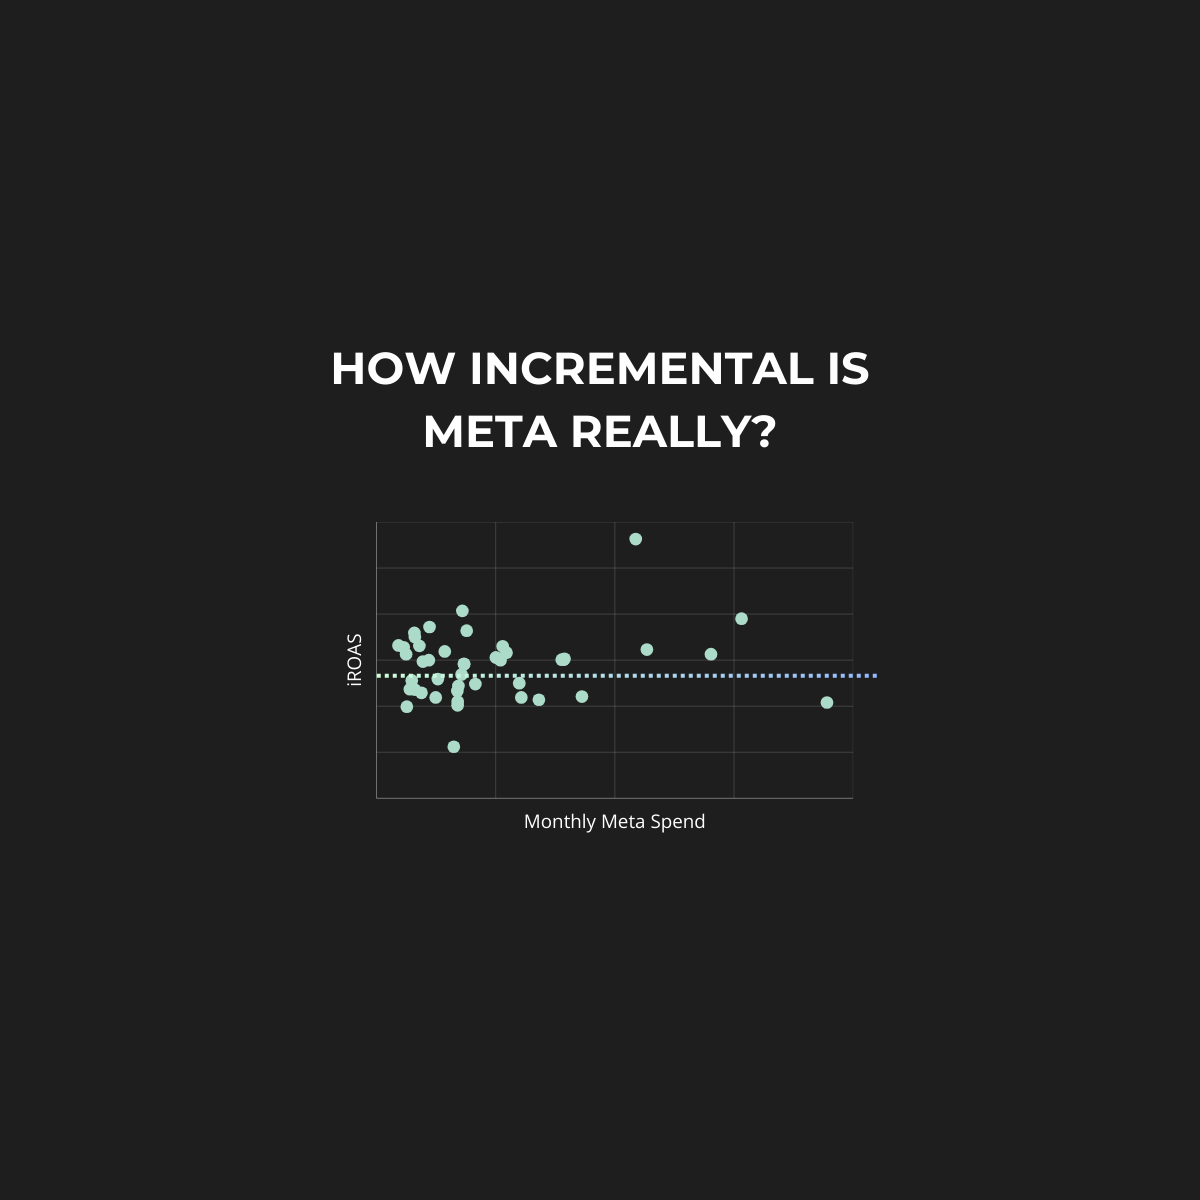
Below is a scatterplot showing Meta iROAS vs. annual brand revenue.
Most iROAS values fell between 1.84 and 3.18, with outliers ranging from 0.91 to 5.63. No strong correlation was observed between brand size and iROAS, suggesting execution had more influence than scale.
.png)
.png)
What Correlated With Higher iROAS
While we did not have access to campaign structure or audience-level targeting, a few patterns emerged across higher-performing brands:
Higher spend with tighter attribution windows
Brands spending over $400K per month on Meta and using 1-day click attribution consistently returned higher iROAS. While this setting does not prove causality, it tends to better reflect immediate revenue contribution in larger accounts where the path to purchase is shorter.
Smaller brands with blended attribution windows
Brands under $20M in annual revenue often showed stronger iROAS when using 7-day click and 1-day view attribution. This likely helped capture view-through and delayed conversions that are more common in lower-volume, higher-consideration environments.
What Improved Model Sensitivity
Incrementality results were more stable and statistically confident in studies that followed these best practices:
Consistent creative and messaging across geographies
When brands maintained the same Meta campaigns across the country and paused spend only in isolated holdout regions, the contrast between test and control became clearer. This reduced confounding variables and improved the model’s ability to detect lift.
Sufficient variation in regional ad exposure
Tests that included full pauses in specific DMAs or states created sharper contrasts than partial cuts or gradual spend shifts. Strong contrasts help isolate the causal impact of Meta spend more effectively.
Correlation Analysis: Incrementality Factor vs. Spend and Platform ROAS
Following the primary holdout analyses, we conducted a secondary assessment to explore whether any observable media variables, specifically monthly Meta spend and platform-reported ROAS—correlated with incrementality factor.
This metric allows for direct comparison between Meta’s reported performance and the observed lift derived from Stella’s geo-based inverse holdout framework.
All brands included in this analysis met the predefined study validity thresholds outlined in the methodology section. Platform ROAS values were normalized to reflect 7-day click and 1-day view attribution, regardless of each brand’s original platform configuration.
1. Meta Spend vs. Incrementality Factor
The first scatterplot (Figure 1) plots each brand’s average monthly Meta ad spend against its corresponding incrementality factor. This analysis aimed to evaluate whether scale of investment was associated with higher or lower alignment between reported and actual contribution.
.png)
Result:
No statistically meaningful correlation was observed. Brands spending over $1 million per month on Meta exhibited a wide range of incrementality factors, as did brands with significantly lower budgets. This finding suggests that budget size alone does not predict the degree to which Meta accurately credits its own impact.
2. Platform ROAS vs. Incrementality Factor
The second chart (Figure 2) compares Meta’s reported ROAS to the incrementality factor observed in the holdout test for each brand.
.png)
Result:
There was no consistent linear relationship between platform-reported ROAS and true incrementality. Some brands with platform ROAS exceeding 4.0 demonstrated incrementality factors below 1.0, indicating potential over-attribution. Others with ROAS near 2.0 showed incrementality factors well above 1.5, indicating under-attribution.
These findings further validate the limitations of relying solely on platform-reported metrics to assess channel performance. While ROAS remains a useful indicator for short-term optimization, it should not be interpreted as a causal measure of business impact without supporting incrementality analysis.
Aggregate Results Summary
Caveats and Considerations
- Only Shopify revenue was measured
This analysis includes only revenue processed through Shopify storefronts. Although some participating brands sold through Amazon and retail, those sources were excluded. Stella has separately observed that Meta can also drive lift in those channels. - Channel-level measurement only
This case study reflects performance at the Meta channel level. No insights were drawn from individual campaigns, audiences, or creative assets.
What This Means for You
If you are managing over $100K per month in Meta spend and using platform ROAS as your sole decision-making metric, you might be missing key context. Incrementality testing provides a more reliable view of Meta’s real contribution to business outcomes.
Stella’s DMA and state-level inverse holdout tests are designed to be fast, non-disruptive, and highly precise. You can get results in under a month and use them to guide budget allocation, adjust ROAS thresholds, or make the case for deeper investment.
Want to see how it works?