Geo-Testing in Marketing: How to Measure True Incrementality (2026 Guide)

Most dashboards tell you who got credit. They do not tell you what actually caused the sale.
That is the point of geo-testing.
Change media in one group of markets. Hold another steady. Compare outcomes. What you are left with is a causal read on whether your spend drove revenue, or whether those customers were going to buy anyway.
U.S. internet ad revenue hit $258.6 billion in 2024, and Dentsu forecasts global ad spend will pass $1 trillion in 2026. When that much money is moving, bad measurement gets expensive fast.
What is geo-testing?
Geo-testing is a market-level experiment. You run ads in some regions, pull back in others, then measure the difference in outcomes. That difference is your incrementality.
It is not perfect. But it is far closer to the truth than last-click attribution.
Google describes geo-based Conversion Lift as a way to measure the causal, incremental impact of campaigns. Meta positions geo-based experiments as the practical option when people-based measurement is blocked. Both treat it as a method for establishing cause and effect, not just reporting on what already happened.
New to incrementality? Our introduction to incrementality testing covers the foundation before you go geo-specific.
What problem does geo-testing actually solve?
The attribution problem.
Platform ROAS looks clean until every platform claims the same sale. Meta says it drove the conversion. Google says it drove the conversion. Your email platform agrees. Add those numbers up and your blended ROAS looks great, but you have almost certainly double or triple-counted the same customers.
Geo-testing forces a harder question: if the ads disappeared in part of the market, would revenue actually drop?
That question is much harder for platforms to game. It is also the question finance actually cares about.
Are you ready to run geo tests?
Not every brand needs geo-testing today. Here is the profile of one that does.
You are spending at least $50K/month on paid media across two or more channels. You are not sure which channel is actually driving incremental sales. Your attribution numbers look great but your business growth feels slower than they suggest. You are selling in multiple places, not just your own site.
If that sounds familiar, you are past the point where attribution alone can tell you what is working. That is when geo-testing becomes necessary.
As of 2025, over 52% of brands and agencies are using incrementality testing to measure and optimize campaigns. The ones that are not are still relying on platform math.
What are the three types of geo tests?
Holdout test
You turn ads off in selected markets. Other markets stay live. If revenue drops in the holdout regions relative to control, that drop is your lift. If it does not drop, you just found budget to cut.
Best for: Validating whether a current channel is earning its spend.
Example: A DTC apparel brand pauses Meta prospecting in 8 holdout DMAs. Revenue in those markets falls 11% relative to control. That 11% is the channel's incremental contribution. Now the brand has a real number to defend the budget with.
Inverse holdout test
Ads stay on in control markets. They get pulled in treatment markets. The loss in treatment regions estimates contribution.
Best for: When a clean holdout is operationally hard to run, or when you want to quantify the revenue risk of cutting a channel before you commit to cutting it.
Scale test
You increase spend in selected markets while control markets hold flat. This tells you whether spending more generates more incremental profit, or just more reported conversions.
Best for: Channels where you suspect you are under-investing and want proof before scaling.
Example: A brand increases Google non-brand search spend by 40% in 6 test DMAs. iROAS in those markets comes in at 1.8x. The brand knows that scaling that channel further is profitable, and by how much.
How do you choose the right markets?
This is where most bad tests die.
Match on behavior, not demographics. Historical revenue, orders, or conversions matter far more than loose demographic similarity. You need markets that move together before the test. If they did not move together before, you will not get a clean read after.
Watch for spillover. If people commute across regions, see national media, or shop across market borders, your control is not really a control. Google's geo-based methodology uses non-overlapping geographies specifically to prevent this.
Use DMAs, not states or zip codes. For DTC brands, DMA-level matching is the sweet spot. State-level is too coarse and gives you too few test cells. Zip-code level is too granular and often lacks enough volume for statistical significance.
Build a synthetic control. A synthetic control is a weighted blend of several markets that together track your treatment market's pre-test behavior. Instead of picking one matching market, you construct the best possible counterfactual from multiple markets combined. The method was formalized by Abadie, Diamond, and Hainmueller and is now standard in marketing measurement. BCG's matched-market methodology recommends at least 95% historical correlation between treatment and control on your primary KPI. Stella's own practitioner's guide to weighted synthetic control methods covers how this works in practice.
How long should a geo test run?
There is no fixed answer. Duration depends on statistical power, not the calendar.
The right approach: start with the minimum lift that would actually change a budget decision. Then back into the budget and runtime required to detect that lift at 80% statistical power. Do not start with a date and work backward.
Across 225 geo-based tests, Stella's benchmark data shows a median duration of 33 days, with a range of 20 to 59 days. Test budgets ranged from roughly $7,000 to $103,000. That spread kills the idea that one default timeline works for every situation.
One detail most guides skip: the cooldown period. After your test window closes, keep tracking results for 1 to 2 weeks. Some conversions happen days after ad exposure, especially for higher-consideration purchases. Cutting off measurement the day the test ends means you miss those. For fast-purchase categories it matters less. For apparel, home goods, or anything with a longer decision cycle, it matters a lot.
What metrics do you read out of a geo test?
Incremental lift is the core number. It is the difference between what happened in treatment markets and what the synthetic control predicted would have happened without the campaign.
Incremental Lift = (Treatment Outcome - Counterfactual Outcome) / Counterfactual Outcome
iROAS is what finance wants to see. Google defines it as incremental conversion value divided by incremental cost. Platform ROAS and iROAS often look very different. That gap is where wasted spend hides.
iROAS = Incremental Revenue / Incremental Ad Spend
Confidence intervals are non-negotiable. A point estimate without uncertainty is a number that invites bad decisions. If your result says iROAS is 2.1x but the confidence interval runs from 0.4x to 4.8x, that is not a decision-grade result. You need more budget, more markets, or more time. Google's geo measurement reporting explicitly includes confidence intervals for exactly this reason.
What do real geo test results look like?
Across 225 geo-based incrementality tests, Stella's benchmark data found:
- Median iROAS: 2.31x
- Interquartile range: 1.36x to 3.24x
- Full range: 0.10x to 15.54x
- Tests reaching statistical significance: 88.4%
The spread is the real lesson. There is no universal benchmark. A 2.31x median means nothing for your business until you test your own channels. The full breakdown by channel is in our 2025 DTC Incrementality Benchmarks report.
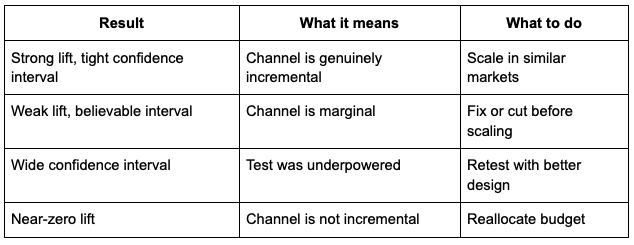
How to read your result:
What are the most common geo-testing mistakes?
Running without a predefined success metric. Decide what "significant enough to act on" means before you launch, not after you see results. Post-hoc goal-shifting is how you end up with biased conclusions.
Peeking at results mid-test. Calling a test early when early numbers look good is one of the most common ways to generate false positives. Set your duration, then leave it alone.
Optimizing for the wrong KPI. Measuring click-based conversions instead of total revenue misses the whole point. The geo test should measure what actually matters to the business, which usually means backend revenue data, not platform-reported conversions.
Treating one test as a permanent truth. Markets shift. Algorithms change. What was incremental six months ago may not be today. A single test is a data point, not a policy.
Running tests in contaminated markets. If your control markets are exposed to national TV, regional radio, or influencer campaigns running simultaneously, your holdout is not clean. Map your full media plan before you assign markets.
Two examples of what this looks like in practice
Example 1: Validating MMM with a geo test
A brand's Media Mix Model shows Pinterest is one of its most efficient channels. The team is skeptical because MMM is correlation-based. They run a 4-week holdout test, pausing Pinterest in a set of randomly assigned DMAs. The geo test result shows Pinterest is genuinely incremental, but the real iROAS is 1.6x, not the 2.4x the MMM predicted. Now they have a causal anchor to recalibrate the model. Future MMM budget recommendations are more accurate because they are grounded in real lift.
Example 2: Measuring omnichannel halo effects
A DTC brand sells on its own site and on Amazon. They want to know if Google ads are also lifting Amazon sales, not just site revenue. They run a GeoLift test using Amazon orders as the primary KPI. Google ads stay on in 60% of DMAs and pause in 40%. The test shows Google is driving meaningful incremental Amazon revenue that was completely invisible in platform attribution. True iROAS for Google, once omnichannel impact is included, is substantially higher than site-only measurement showed. The team scales search with confidence.
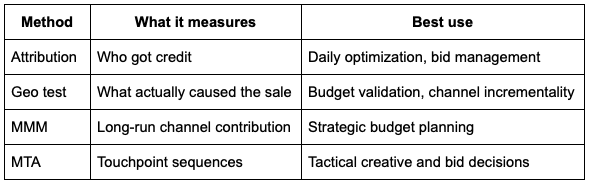
How does geo-testing fit with MMM and attribution?
They are not competing. They are layers.
Attribution tells you what your platforms say happened. Geo tests tell you what actually happened. MMM uses both to tell you where to go next.
The sequence that works:
- Run geo tests on your highest-spend channels first.
- Feed those lift estimates into your MMM as calibration anchors.
- Use the MMM to plan cross-channel budget allocation.
- Use those insights to design the next round of geo tests.
This loop only works if you test consistently, not once a year. Our always-on incrementality framework is built around keeping that cycle running.
Geo test results are the cleanest input you can give a Media Mix Model. Without them, MMM coefficients rely on correlational signals that attribution models have already distorted. With them, you are grounding the model in cause and effect.
Why geo-testing matters more now than it did five years ago
Apple's App Tracking Transparency cut access to user-level data starting in 2021. Google's Privacy Sandbox is reshaping what is measurable at the individual level. Platform-reported metrics have never been more optimistic.
At the same time, digital is getting bigger. Dentsu projects digital will represent 68.7% of total global ad investment in 2026. That is a lot of budget to defend with platform screenshots.
Geo-testing is durable in this environment because it does not rely on user tracking. You are comparing aggregate regional outcomes. No cookies. No IDFA. The method works the same way today as it did in 2018, which is exactly why it is becoming the standard.
Quick answers to common geo-testing questions
What is geo-testing in one sentence? A market-level experiment that measures the causal impact of advertising by comparing regions with a media change against similar regions without one.
Is geo-testing better than attribution? For causality, yes. Attribution shows who got credit. Geo-testing estimates what actually changed because of the media. They answer different questions. You need both.
How long does a geo test take? Stella's benchmark across 225 tests: median 33 days, range 20 to 59 days. Duration depends on your spend level, effect size, and how tight you need the confidence interval.
What is a good iROAS? One that clears your margin hurdle with a confidence interval narrow enough to act on. The Stella benchmark median is 2.31x, but the spread is wide. Your margin structure matters more than the industry number.
Do I need a big budget? Stella has seen tests run on as little as $7,000. The real constraint is conversion volume in your test markets. Lower volume means longer runtimes to reach significance.
What if my result is inconclusive? The test was probably underpowered. Check market matching quality, check whether the runtime was long enough, and check whether any external events contaminated the control. Retest with a tighter design. Do not make a budget call from an underpowered test.
Ready to run a geo test?
Start with your hardest budget question. Not "can we test?" but "which channel are we least sure about?"
Stella automates market matching, test design, and lift analysis so you spend time on decisions, not spreadsheets. Schedule a demo to see how it works.